Humphrey visual field analyser
The first number denotes the extent of the field measured on the temporal side, from the centre of fixation, in degrees.
The test type and eye are firstly selected and the patient's details are entered, including their refractive error.
In these instances, wire-rimmed trial lenses are generally used, with the cylindrical lens placed closest to the patient so the axis is easily read.
Minor adjustments to the head position are made to centre the pupil on the display screen to allow eye monitoring throughout the test.
[12] The analyser projects a series of white light stimuli of varying intensities (brightness), throughout a uniformly illuminated bowl.
[1] The analyser currently utilises the Swedish Interactive Thresholding Algorithm (SITA); a formula which allows the fastest and most accurate visual field assessment to date.
Results are then compared against an age-matched database which highlights unusual and suspicious vision loss, potentially caused by pathology.
These include, but not limited to, the patient losing concentration, closing their eyes or pressing the buzzer too frequently.
Monitoring fixation is made visible via the display screen and gaze tracker, located at the bottom of the printout.
[16] The grey scale is a graphical representation of the numerical display, allowing for easy interpretation of the field loss.
[3] The statistical display (located below the numerical total) demonstrates the percentage of the normal population who measure below the patient's value at a specific retinal point.
[3] For example, the darkest square in the key represents that <0.5% of the population would also attain this result, indicating that the vision loss is extensive.
[3] They include: The glaucoma hemifield test (GHT) provides assessment of the visual field where glaucomatous damage is often seen.
[3] The visual field index (VFI) reflects retinal ganglion cell loss and function, as a percentage, with central points weighted more.


1: Reliability Indices
2: Numerical Display
3: Grey Scale
4: Total Deviation
5: Probability Display
6: Pattern Deviation
7: Global Indices
8: Glaucoma Hemifield Test
9: Visual Field Index
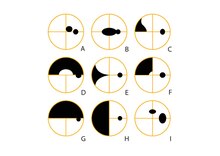
A: Central scotoma
B: Centrocaecal scotoma
C: Nasal Step
D: Superior Arcuate
E: Nasal Wedge defect
F: Superior Nasal quadrantanopia
G: Superior Altitudinal
H: Nasal hemianopia
I: Enlarged Blind Spot with Paracentral scotoma located 15 degrees superiorly

A: Aphakia
B: Rim artefact
C: Chin slip
D: Lens position
E: Corneal opacity
F: Keratoconus
G: Ptosis
H: Pupil Miosis - 1mm
I: Pupil Miosis - 3mm