[2] In hydrology and transportation planning isochrone maps are commonly used to depict areas of equal travel time.
Increases in computation, data storage, and improvements in algorithms have facilitated the rapid generation of isochrones.
[1] Isochrone and related maps are used to show the time taken for runoff water within a drainage basin to reach a lake, reservoir or outlet, assuming constant and uniform effective rainfall.
Put simply, the output of an isochrone map for transport will show how far (in distance) is reachable from a start point, including the parameter of time.
Such maps for private motor transport were widely used in a 1972 study into airport accessibility in Hampshire, South East England.
Isochrone map showing drive times around airports in northern Finland, created using
GIS software
(2011)
Rates of travel in America, 1800 to 1930.
[
7
]
plate 138, page 366)
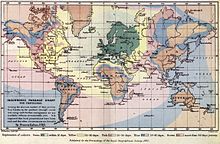
Francis Galton's
first known isochronic map published for the
Proceedings of the Royal Geographical Society
, 1881. It shows the travel times in 1881 from
London
,
United Kingdom
to different parts of the world in days. It assumes that there are favourable travel conditions and that travel arrangements over land have been made in advance. It assumes travelling methods of the day within a reasonable cost.
An early isochrone map of
Melbourne
rail transport travel times, 1910–1922
Isochrone map of Toronto comparing travel times between bicycle and public transit (2016)
[
1
]