Isoquant
[1][2] The x and y axis on an isoquant represent two relevant inputs, which are usually a factor of production such as labour, capital, land, or organisation.
Indifference curves further differ to isoquants, in that they cannot offer a precise measurement of utility, only how it is relevant to a baseline.
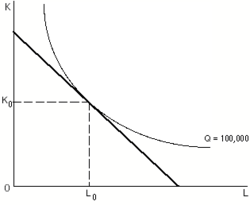
In managerial economics, isoquants are typically drawn along with isocost curves in capital-labor graphs, showing the technological tradeoff between capital and labor in the production function, and the decreasing marginal returns of both inputs.
As such, isoquants by nature are downward sloping due to operation of diminishing marginal rates of technical substitution (MRTS).
The contour line of an isoquant represents every combination of two inputs which fully maximise a firm's use of resources (such as budget, or time).
A firm can choose to utilise the information an isoquant gives on returns to scale, by using it as insight how to allocate resources.
Thus, they can be used as a tool to help management make better informed decisions regarding production and profit dilemmas, such as cost or waste minimization, and revenue and output maximization.
Finally, any combination of inputs above or to the right of an isoquant results represents a higher level of output, and vice versa.
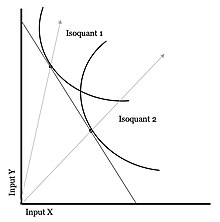
Isoquants are typically combined with isocost lines in order to solve a cost-minimization problem for given level of output.
A line joining tangency points of isoquants and isocosts (with input prices held constant) is called the expansion path.