Isothermal microcalorimetry
Over a period of hours or days, IMC determines the onset, rate, extent and energetics of such processes for specimens in small ampoules (e.g. 3–20 ml) at a constant set temperature (c. 15 °C–150 °C).
Applications discussed range from measurement of slow oxidative degradation of polymers and instability of hazardous industrial chemicals to detection of bacteria in urine and evaluation of the effects of drugs on parasitic worms.
In biological specimens containing a growth medium, appearance over time of a detectable and rising heat flow signal is a simple general indicator of the presence of some type of replicating cells.
IMC is extremely sensitive – e.g. heat from slow chemical reactions in specimens weighing a few grams, taking place at reactant consumption rates of a few percent per year, can be detected and quantified in a matter of days.
This work took advantage of the parallel development of solid-state electronic devices—particularly commercial availability of small thermoelectric effect (Peltier-Seebeck) devices for converting heat flow into voltage—and vice versa.
This work took advantage of the parallel development of personal computer technology which greatly augmented the ability to easily store, process and interpret heat flow vs. time data.
In connection with wider use, substantial attention has been paid to creating standards for describing the performance of IMC instruments (e.g. precision, accuracy, sensitivity) and for methods of calibration (Wadsö and Goldberg 2001).
[citation needed] Alternatively, IMC instruments can be equipped with duplex modules which yield signals proportional to the heat flow difference between two ampoules.
This provides a means for eliminating minor heat-producing reactions which are not of interest—for example gradual chemical changes over a period of days in a cell culture medium at the measurement temperature.
[7] In either hc or pc mode, the resulting signal is a computer-recordable voltage, calibrated to represent specimen μ W-range heat flow vs. time.
IMC heat flow data are obtained as voltage fluctuations vs. time, stored as computer files and can be displayed essentially in real time—as the rate process is occurring.
For comparisons of the effect of experimental variables (e.g. initial concentrations) on rate processes, IMC does not require development and use of chemical or other assay methods.
It is often necessary to design and conduct preliminary studies intended to systematically determine if multiple processes are taking place and if so, their contributions to aggregate heat flow.
To provide air of known humidity for such studies, small containers of saturated salt solutions can be placed in an IMC ampoule along with a non-hydrated mineral specimen.
[20]) IMC has the ability to detect slow degradation during simulated shelf storage far sooner than conventional analytical methods and without the need to employ chemical assay techniques.
[22] The term metabolismics can be used[citation needed] to describe studies of the quantitative measurement of the rate at which heat is produced or consumed vs. time by cells (including microbes) in culture, by tissue specimens, or by small whole organisms.
As described subsequently, metabolismics can be useful as a diagnostic tool; especially in either (a) identifying the nature of a specimen from its heat flow vs. time signature under a given set of conditions, or (b) determining the effects of e.g. pharmaceutical compounds on metabolic processes, organic growth or viability.
A landmark 2002 general paper on the topic of metabolism provides an excellent perspective from which to consider IMC metabolismic studies (see Bibliography, West, Woodruff and Brown 2002).
It includes explanatory text and 42 references to IMC studies of heat flow from cultured human erythrocytes, platelets, lymphocytes, lymphoma cells, granulocytes, adipocytes, skeletal muscle, and myocardial tissue.
[26] A related paper covers the general topic of applying IMC in the field of synthetic solid materials used in surgery and medicine (Lewis and Daniels 2003).
Much more recently (Liu et al. 2007),[31] IMC has been shown to provide dynamic metabolic data which assess toxicity against fibroblasts of Cr(VI) from potassium chromate.
"Simple closed ampoule IMC has also been used and advocated for assessing the cultured cell toxicity of candidate surgical implant materials—and thus serve as a biocompatibility screening method.
In one study (Xie et al. 2000)[32] porcine renal tubular cells in culture were exposed to both polymers and titanium metal in the form of "microplates" having known surface areas of a few cm2.
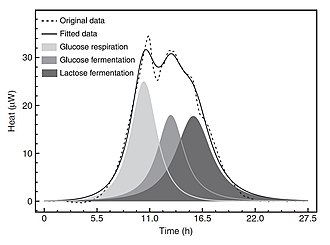
The paper also explains how heat flow vs. time data for bacteria in culture are an exact expression—as they occur over time—of the fluctuations in microorganism metabolic activity and replication rates in a given medium (Fig.
[47] Analogous successful use of IMC to determine the effects of antitumor drugs on tumor cells in culture within a few hours has been demonstrated (Schön and Wadsö 1988).
[54] An interesting feature of these studies is the use of a simple manual injection system for introducing the pharmaceuticals into sealed ampoules containing the worms.
[56] Using an optimized medium, growth of six different strains of soil bacteria was easily monitored and reproducibly quantified and differentiated over a period days.
An overview (Wadsö and Galindo 2009)[59] discusses successful applications in assessing vegetable cutting wound respiration, cell death from blanching, milk fermentation, microbiological spoilage prevention, thermal treatment and shelf life.
Another publication (Galindo et al. 2005)[60] reviews the successful use of IMC for monitoring and predicting quality changes during storage of minimally processed fruits and vegetables.
[63] IMC has also proven effective in assessing the extent to which low-energy pulsed electric fields (PEFs) affect the heat of germination of barley seeds—important in connection with their use in producing malted beverages (Dymek et al.
Fig. 1

Fig. 2
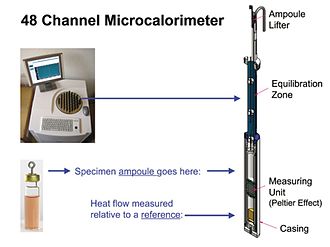
Fig. 3

Fig. 4