Differential scanning calorimetry
Additionally, the reference sample must be stable, of high purity, and must not experience much change across the temperature scan.
The technique was developed by E. S. Watson and M. J. O'Neill in 1962,[3] and introduced commercially at the 1963 Pittsburgh Conference on Analytical Chemistry and Applied Spectroscopy.
The first adiabatic differential scanning calorimeter that could be used in biochemistry was developed by P. L. Privalov and D. R. Monaselidze in 1964 at Institute of Physics in Tbilisi, Georgia.
This setup makes it possible to have a small, light, and low-heat capacity structure while still working like a regular DSC oven.
The electrical power that is required to obtain and maintain this state is then recorded rather than the temperature difference between the two crucibles.
[10] The 2000s have witnessed the rapid development of Fast-scan DSC (FSC),[11] a novel calorimetric technique that employs micromachined sensors.
[12] Nanocalorimetry [13] has attracted much attention in materials science, where it is applied to perform quantitative analysis of rapid phase transitions, particularly on fast cooling.
Another emerging area of application of FSC is physical chemistry, with a focus on the thermophysical properties of thermally labile compounds.
The benefit of this procedure is the ability to separate overlapping DSC effects by calculating the reversing and the non-reversing signals.
The basic principle underlying this technique is that when the sample undergoes a physical transformation such as phase transitions, more or less heat will need to flow to it than the reference to maintain both at the same temperature.
It is widely used in industrial settings as a quality control instrument due to its applicability in evaluating sample purity and for studying polymer curing.
There are two different conventions: exothermic reactions in the sample shown with a positive or negative peak, depending on the kind of technology used in the experiment.
The ability to determine transition temperatures and enthalpies makes DSC a valuable tool in producing phase diagrams for various chemical systems.
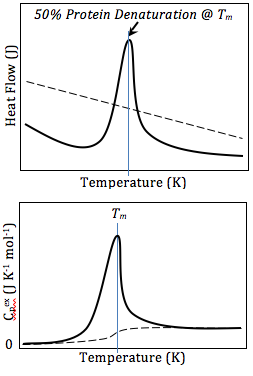
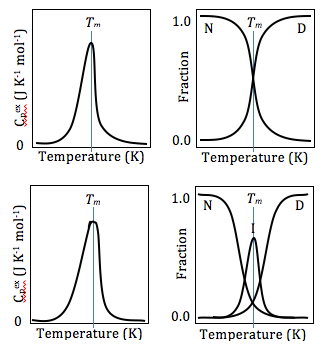
[21] In studying protein denaturation using DSC, the thermal melt should be at least to some degree reversible, as the thermodynamics calculations rely on chemical equilibrium.
Measurements without crucible should only be conducted with chemically stable materials at low temperatures, as otherwise there may be contamination or damage of the calorimeter.
A small sample mass (~10 mg) is sufficient if the released or consumed heat during the transformation is high enough.
However, the increasing sample size might worsen the resolution due to thermal gradients which may evolve during heating.
Due to the faster scan rate, more energy is released or consumed in a shorter time which leads to higher and therefore more distinct peaks.
Due to this thermal lag, two phase transformations (or chemical reactions) occurring in a narrow temperature range might overlap.
Purge gas is used to control the sample environment, in order to reduce signal noise and to prevent contamination.
The equipment is easy to calibrate, using low melting indium at 156.5985 °C for example, and is a rapid and reliable method of thermal analysis.
[citation needed] The percent crystalline content of a polymer can be estimated from the crystallization/melting peaks of the DSC graph using reference heats of fusion found in the literature.
Impurities in polymers can be determined by examining thermograms for anomalous peaks, and plasticisers can be detected at their characteristic boiling points.
In this test a sample (and a reference) are exposed to an oxygen atmosphere and subjected to a constant rate of heating (typically from 50 to 300 °C).
In this mode the sample will be housed in a non-reactive crucible (often gold or gold-plated steel), and which will be able to withstand pressure (typically up to 100 bar).
However, due to a combination of relatively poor sensitivity, slower than normal scan rates (typically 2–3 °C/min, due to much heavier crucible) and unknown activation energy, it is necessary to deduct about 75–100 °C from the initial start of the observed exotherm to suggest a maximal temperature for the material.
A much more accurate data set can be obtained from an adiabatic calorimeter, but such a test may take 2–3 days from ambient at a rate of a 3 °C increment per half-hour.
The cross-linking of polymer molecules that occurs in the curing process is exothermic, resulting in a negative peak in the DSC curve that usually appears soon after the glass transition.