Log Gabor filter
While the Fourier transform gives the frequency information of the signal, it is not localized.
This means that we cannot determine which part of a (perhaps long) signal produced a particular frequency.
To provide a more flexible space-frequency signal decomposition several filters (including wavelets) have been proposed.
The Log-Gabor filter is able to describe a signal in terms of the local frequency responses.
Corners are useful to find because they represent stable locations that can be used for image matching problems.
The corner can be described in terms of localized frequency information by using a Log-Gabor filter.
[5] In pattern recognition, the input image must be transformed into a feature representation that is easier for a classification algorithm to separate classes.
[7] There are a host of other applications that require localized frequency information.
There are several existing approaches for computing localized frequency information.
These approaches are advantageous because unlike the Fourier transform, these filters can more easily represent discontinuities in the signal.
For example, the Fourier transform can represent an edge, but only by using an infinite number of sine waves.
[2] Because of this, the Gabor filter is a good method for simultaneously localizing spatial/temporal and frequency information.
A Gabor filter in the space (or time) domain is formulated as a Gaussian envelope multiplied by a complex exponential.
It was found that the cortical responses in the human visual system can be modeled by the Gabor filter.
[7][13] The Gabor filter was modified by Morlet to form an orthonormal continuous wavelet transform.
If the output of the filter is to be used for an application such as pattern recognition, this DC component is undesirable because it gives a feature that changes with the average value.
Also the original Gabor filter has an infinite length impulse response.
Finally, the original Gabor filter, while optimum in the sense of uncertainty, does not properly fit the statistics of natural images.
As shown in,[1] it is better to choose a filter with a longer sloping tail in an image coding task.
Although there are many such decompositions possible, here we briefly present two popular methods: Mexican hat wavelets and the steerable pyramid.
This difference of Gaussian function has found use in several computer vision applications such as keypoint detection.
[15] The disadvantage of the Mexican hat wavelet is that it exhibits some aliasing and does not represent oblique orientations well.
The steerable pyramid decomposition [16] was presented as an alternative to the Morlet (Gabor) and Ricker wavelets.
This decomposition ignores the orthogonality constraint of the wavelet formulation, and by doing this is able to construct a set of filters which are both translation and rotation independent.
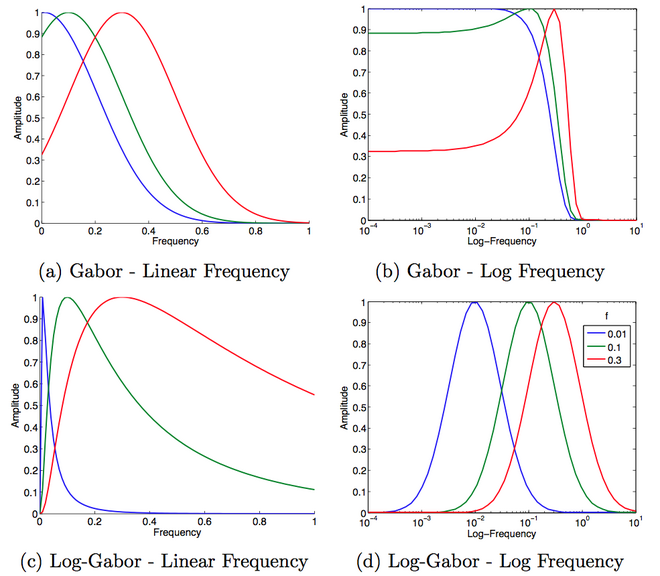
The following figure shows the frequency response of the Gabor compared with the Log-Gabor: Another definition of the Log-Gabor filter is to consider it as a probability distribution function, with a normal distribution, but considering the logarithm of frequencies.
This makes sense in contexts where the Weber–Fechner law applies, such as in visual or auditive perception.
Following the change of variable rule, a one dimensional Log-Gabor function has thus the modified frequency response:
In both definitions, because of the zero at the DC value, it is not possible to derive an analytic expression for the filter in the space domain.
The orientation component is a Gaussian distance function according to the angle in polar coordinates (see [1] or [2]):
The necessary parameters that must be chosen are: the minimum and maximum frequencies, the filter bandwidth, the number of orientations, the angular bandwidth, the filter scaling and the number of scales.