Microarray analysis techniques
Microarray analysis techniques are used in interpreting the data generated from experiments on DNA (Gene chip analysis), RNA, and protein microarrays, which allow researchers to investigate the expression state of a large number of genes – in many cases, an organism's entire genome – in a single experiment.
[1] Such experiments can generate very large amounts of data, allowing researchers to assess the overall state of a cell or organism.
There are also open source options that utilize a variety of methods for analyzing microarray data.
LIMMA provides a set of tools for background correction and scaling, as well as an option to average on-slide duplicate spots.
Robust Multi-array Average (RMA)[8] is a normalization approach that does not take advantage of these mismatch spots but still must summarize the perfect matches through median polish.
[9] The median polish algorithm, although robust, behaves differently depending on the number of samples analyzed.
Many strategies exist to identify array probes that show an unusual level of over-expression or under-expression.
Curiously, the p-values associated with particular genes do not reproduce well between replicate experiments, and lists generated by straight fold change perform much better.
[14][15] This represents an extremely important observation, since the point of performing experiments has to do with predicting general behavior.
Empirical comparisons of k-means, k-medoids, hierarchical methods and, different distance measures can be found in the literature.
Non-commercial tools such as FunRich,[23] GenMAPP and Moksiskaan also aid in organizing and visualizing gene network data procured from one or several microarray experiments.
[27] The tool can identify the dynamic protein complex regulation under different condition or time points.
Another statistical analysis tool is Rank Sum Statistics for Gene Set Collections (RssGsc), which uses rank sum probability distribution functions to find gene sets that explain experimental data.
[30] A further approach is contextual meta-analysis, i.e. finding out how a gene cluster responds to a variety of experimental contexts.
Genevestigator is a public tool to perform contextual meta-analysis across contexts such as anatomical parts, stages of development, and response to diseases, chemicals, stresses, and neoplasms.
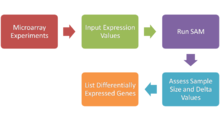
With the advent of DNA microarrays, it is now possible to measure the expression of thousands of genes in a single hybridization experiment.
In this method, repeated permutations of the data are used to determine if the expression of any gene is significant related to the response.
[35] the number of permutations is set by the user when imputing correct values for the data set to run SAM Types:[32] SAM calculates a test statistic for relative difference in gene expression based on permutation analysis of expression data and calculates a false discovery rate.
Depending on the type of array, signal related to nonspecific binding of the fluorophore can be subtracted to achieve better results.
A variety of tools for background correction and further analysis are available from TIGR,[40] Agilent (GeneSpring),[41] and Ocimum Bio Solutions (Genowiz).
[42] Visual identification of local artifacts, such as printing or washing defects, may likewise suggest the removal of individual spots.