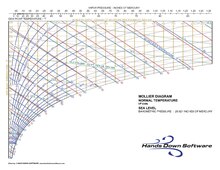
Enthalpy–entropy chart
[2] A typical chart covers a pressure range of 0.01–1000 bar, and temperatures up to 800 degrees Celsius.
[1] In an isobaric process, the pressure remains constant, so the heat interaction is the change in enthalpy.
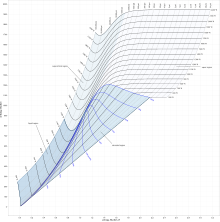
The process 3–4 in a Rankine cycle is isentropic when the steam turbine is said to be an ideal one.
Later the deviations from the ideal values and they can be calculated considering the isentropic efficiency of the steam turbine used.)
[3] X gives the fraction (by mass) of gaseous substance in the wet region, the remainder being colloidal liquid droplets.
Above the heavy line, the temperature is above the boiling point, and the dry (superheated) substance is gas only.
[3] Hence the chart is only useful for enthalpy changes in the expansion process of the steam cycle.
[9] The underlying property data for the Mollier diagram is identical to a psychrometric chart.