Multitaper
In signal processing, multitaper analysis is a spectral density estimation technique developed by David J.
[1] [2] It can estimate the power spectrum SX of a stationary ergodic finite-variance random process X, given a finite contiguous realization of X as data.
For instance, a single trial represents only one noisy realization of the underlying process of interest.
Likewise, a single sample of a process does not necessarily provide a reliable estimate of its spectral properties.
These problems are often overcome by averaging over many realizations of the same event after applying a taper to each trial.
However, this method is unreliable with small data sets and undesirable when one does not wish to attenuate signal components that vary across trials.
Applying a single taper reduces bias but at the cost of increased estimator variance due to attenuation of activity at the start and end of each recorded segment of the signal.
The multitaper method partially obviates these problems by obtaining multiple independent estimates from the same sample.
Each data taper is multiplied element-wise by the signal to provide a windowed trial from which one estimates the power at each component frequency.
Moreover, even when many trials are available the multitaper approach is useful as it permits more rigorous control of the trade-off between bias and variance than what is possible in the single taper case.
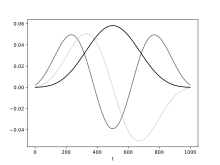
Thomson chose the Slepian functions[4] or discrete prolate spheroidal sequences as tapers since these vectors are mutually orthogonal and possess desirable spectral concentration properties (see the section on Slepian sequences).
In practice, a weighted average is often used to compensate for increased energy loss at higher order tapers.
and is chosen as follows: We choose a set of K orthogonal data tapers such that each one provides a good protection against leakage.
[7] See also Window function:DPSS or Slepian window Not limited to time series, the multitaper method is easily extensible to multiple Cartesian dimensions using custom Slepian functions,[8] and can be reformulated for spectral estimation on the sphere using Slepian functions constructed from spherical harmonics[9] for applications in geophysics and cosmology[10][11] among others.
An extensive treatment about the application of this method to analyze multi-trial, multi-channel data generated in neuroscience, biomedical engineering and elsewhere can be found here.