Nonlinear regression
In statistics, nonlinear regression is a form of regression analysis in which observational data are modeled by a function which is a nonlinear combination of the model parameters and depends on one or more independent variables.
The data are fitted by a method of successive approximations (iterations).
In nonlinear regression, a statistical model of the form, relates a vector of independent variables,
For example, the Michaelis–Menten model for enzyme kinetics has two parameters and one independent variable, related by
by:[a] This function, which is a rectangular hyperbola, is nonlinear because it cannot be expressed as a linear combination of the two
s. Systematic error may be present in the independent variables but its treatment is outside the scope of regression analysis.
When so transformed, standard linear regression can be performed but must be applied with caution.
In general, there is no closed-form expression for the best-fitting parameters, as there is in linear regression.
Usually numerical optimization algorithms are applied to determine the best-fitting parameters.
Again in contrast to linear regression, there may be many local minima of the function to be optimized and even the global minimum may produce a biased estimate.
In practice, estimated values of the parameters are used, in conjunction with the optimization algorithm, to attempt to find the global minimum of a sum of squares.
The assumption underlying this procedure is that the model can be approximated by a linear function, namely a first-order Taylor series: where
Therefore, more caution than usual is required in interpreting statistics derived from a nonlinear model.
The best-fit curve is often assumed to be that which minimizes the sum of squared residuals.
Some nonlinear regression problems can be moved to a linear domain by a suitable transformation of the model formulation.
For example, consider the nonlinear regression problem with parameters a and b and with multiplicative error term U.
The influences of the data values will change, as will the error structure of the model and the interpretation of any inferential results.
On the other hand, depending on what the largest source of error is, a nonlinear transformation may distribute the errors in a Gaussian fashion, so the choice to perform a nonlinear transformation must be informed by modeling considerations.
For error distributions that belong to the exponential family, a link function may be used to transform the parameters under the Generalized linear model framework.
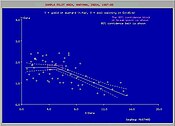
[3] The figure shows that the soil salinity (X) initially exerts no influence on the crop yield (Y) of mustard, until a critical or threshold value (breakpoint), after which the yield is affected negatively.