Percolation threshold
In engineering and coffee making, percolation represents the flow of fluids through porous media, but in the mathematics and physics worlds it generally refers to simplified lattice models of random systems or networks (graphs), and the nature of the connectivity in them.
[1] The most common percolation model is to take a regular lattice, like a square lattice, and make it into a random network by randomly "occupying" sites (vertices) or bonds (edges) with a statistically independent probability p. At a critical threshold pc, large clusters and long-range connectivity first appear, and this is called the percolation threshold.
More general systems have several probabilities p1, p2, etc., and the transition is characterized by a critical surface or manifold.
One can also consider continuum systems, such as overlapping disks and spheres placed randomly, or the negative space (Swiss-cheese models).
To understand the threshold, you can consider a quantity such as the probability that there is a continuous path from one boundary to another along occupied sites or bonds—that is, within a single cluster.
When the system size goes to infinity, P(p) will be a step function at the threshold value pc.
In the systems described so far, it has been assumed that the occupation of a site or bond is completely random—this is the so-called Bernoulli percolation.
For a continuum system, random occupancy corresponds to the points being placed by a Poisson process.
Another variation of recent interest is Explosive Percolation, whose thresholds are listed on that page.
Over the last several decades, a tremendous amount of work has gone into finding exact and approximate values of the percolation thresholds for a variety of these systems.
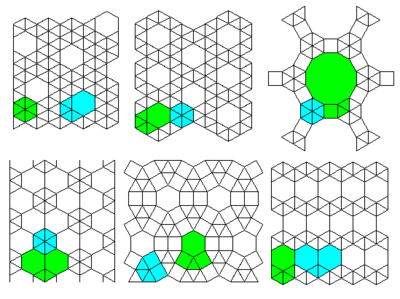
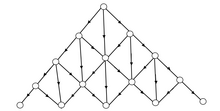
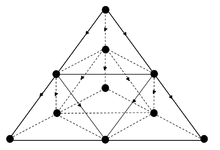
Exact thresholds are only known for certain two-dimensional lattices that can be broken up into a self-dual array, such that under a triangle-triangle transformation, the system remains the same.
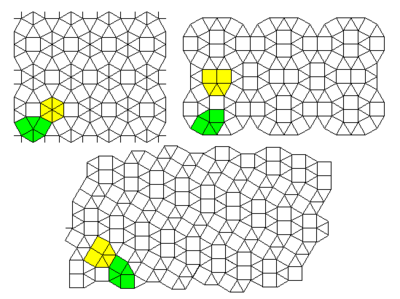
The notation such as (4,82) comes from Grünbaum and Shephard,[3] and indicates that around a given vertex, going in the clockwise direction, one encounters first a square and then two octagons.
This indicates that for a given degree distribution, the clustering leads to a larger percolation threshold, mainly because for a fixed number of links, the clustering structure reinforces the core of the network with the price of diluting the global connections.
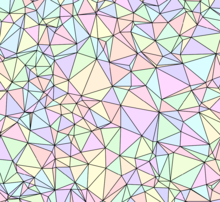
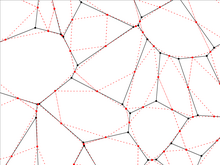
[39] Here, one distorts a regular lattice of unit spacing by moving vertices uniformly within the box
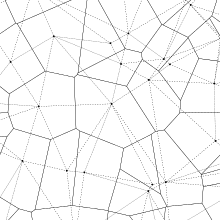
This lattice is in the isoradial representation in which each polygon is inscribed in a circle of unit radius.
The two squares in the 2-uniform lattice must now be represented as a single rectangle in order to satisfy the isoradial condition.
The green circles show the isoradial constraint on both the original and dual lattices.
[79] (For more results and comparison to the jamming density, see Random sequential adsorption) The threshold gives the fraction of sites occupied by the objects when site percolation first takes place (not at full jamming).
System is composed of ordinary (non-avoiding) random walks of length l on the square lattice.
[102] For the monodisperse particle systems, the percolation thresholds of concave-shaped superdisks are obtained as seen in [121] For binary dispersions of disks, see [95][122][123] *Theoretical estimate Assuming power-law correlations
Question: the bond thresholds for the hcp and fcc lattice agree within the small statistical error.
See [189] Here, one distorts a regular lattice of unit spacing by moving vertices uniformly within the cube
The coverage φc is the net fraction of sites covered, and v is the volume (number of cubes).
is the critical volume fraction, valid for overlapping randomly placed objects.
[201] For spherocylinders, H/D is the ratio of the height to the diameter of the cylinder, which is then capped by hemispheres.
[198] For superballs, m is the deformation parameter, the percolation values are given in.,[214][215] In addition, the thresholds of concave-shaped superballs are also determined in [121] For cuboid-like particles (superellipsoids), m is the deformation parameter, more percolation values are given in.
refers to the fraction of the space occupied by the voids (not of the particles) at the critical point, and is related to
is the total volume of the overlapping objects For thresholds on high dimensional hypercubic lattices, we have the asymptotic series expansions [236] [244] [247]
For 13-dimensional bond percolation, for example, the error with the measured value is less than 10−6, and these formulas can be useful for higher-dimensional systems.
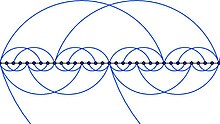
Note: {m,n} is the Schläfli symbol, signifying a hyperbolic lattice in which n regular m-gons meet at every vertex For bond percolation on {P,Q}, we have by duality