Personal income in the United States
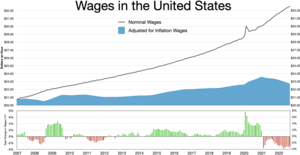
The Bureau of Labor Statistics reported a median weekly personal income of $1,139 for full-time workers in the United States in Q1 2024.
[5] According to the US Census, men tended to have higher income than women, while Asians and Whites earned more than African Americans and Hispanics.
BEA's statistics relate personal income to measures of production, including GDP, and is considered an indicator of consumer spending.
Income that is not earned from production in the current period—such as capital gains, which relate to changes in the price of assets over time—is excluded.
BEA's monthly personal income estimates are one of several key macroeconomic indicators that the National Bureau of Economic Research considers when dating the business cycle.
[10] Field of study significantly affects earning potential, and the more specific education is disaggregated, the larger the variance.
[13] A 2011 report by Georgetown University on full-time, employed earners found that median income for specific majors varied from $29,000 for Counseling Psychology to $120,000 for Petroleum Engineering.
Among those with a master's, professional or doctorate degree, those who identified as White had the highest median individual income.
[23][24] Those identifying as Hispanic or Latino (who may have been of any race) had the lowest overall median personal income, earning 28.51% less than Whites[24][25] and 35% less than Asian Americans.
Thus one can observe a significant discrepancy with the median income of Asians and Whites and that of African Americans and Hispanics.
While the gap remains numerically unchanged, the percentage difference between the two races has decreased as a result of mutual increases in median personal income.
According to the U.S Census Bureau "The per capita income for the overall population in 2008 was $26,964; for non-Hispanic Whites, it was $31,313; for Blacks, it was $18,406; for Asians, it was $30,292; and for Hispanics, it was $15,674.

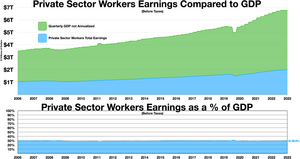
Private sector workers made approximately $2 trillion, or about 29.6% of all money earned in Q3 2023 (before taxes)


