Phase diagram
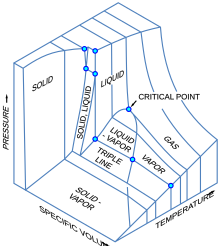
A phase diagram in physical chemistry, engineering, mineralogy, and materials science is a type of chart used to show conditions (pressure, temperature, etc.)
at which thermodynamically distinct phases (such as solid, liquid or gaseous states) occur and coexist at equilibrium.
For example, the water phase diagram has a triple point corresponding to the single temperature and pressure at which solid, liquid, and gaseous water can coexist in a stable equilibrium (273.16 K and a partial vapor pressure of 611.657 Pa).
The open spaces, where the free energy is analytic, correspond to single phase regions.
This reflects the fact that, at extremely high temperatures and pressures, the liquid and gaseous phases become indistinguishable,[3] in what is known as a supercritical fluid.
In water, the critical point occurs at around Tc = 647.096 K (373.946 °C), pc = 22.064 MPa (217.75 atm) and ρc = 356 kg/m3.
[4] The existence of the liquid–gas critical point reveals a slight ambiguity in labelling the single phase regions.
[7] Water is an exception which has a solid-liquid boundary with negative slope so that the melting point decreases with pressure.
At a molecular level, ice is less dense because it has a more extensive network of hydrogen bonding which requires a greater separation of water molecules.
An orthographic projection of the 3D p–v–T graph showing pressure and temperature as the vertical and horizontal axes collapses the 3D plot into the standard 2D pressure–temperature diagram.
Other much more complex types of phase diagrams can be constructed, particularly when more than one pure component is present.
Phase diagrams can use other variables in addition to or in place of temperature, pressure and composition, for example the strength of an applied electrical or magnetic field, and they can also involve substances that take on more than just three states of matter.
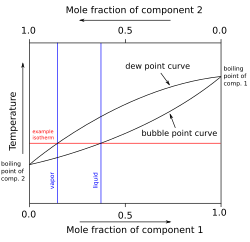
The construction of a liquid vapor phase diagram assumes an ideal liquid solution obeying Raoult's law and an ideal gas mixture obeying Dalton's law of partial pressure.
A complex phase diagram of great technological importance is that of the iron–carbon system for less than 7% carbon (see steel).
As the mixtures are typically far from dilute and their density as a function of temperature is usually unknown, the preferred concentration measure is mole fraction.
At constant pressure the maximum number of independent variables is three – the temperature and two concentration values.
The prism sides represent corresponding binary systems A-B, B-C, A-C.
Attention has been directed to mesophases because they enable display devices and have become commercially important through the so-called liquid-crystal technology.