Reflection high-energy electron diffraction
Video 1 depicts a metrology instrument recording the RHEED intensity oscillations and deposition rate for process control and analysis.
[1] Dynamic scattering occurs when electrons undergo multiple diffraction events in the crystal and lose some of their energy due to interactions with the sample.
Ewald's spheres show the allowed diffraction conditions for kinematically scattered electrons in a given RHEED setup.
The user must relate the geometry and spacing of the spots of a perfect pattern to the Ewald's sphere in order to determine the reciprocal lattice of the sample surface.
The Ewald's sphere analysis is similar to that for bulk crystals, however the reciprocal lattice for the sample differs from that for a 3D material due to the surface sensitivity of the RHEED process.
(3) Figure 3 shows the construction of the Ewald's sphere and provides examples of the G, khl and ki vectors.
The radius of the Ewald's sphere is much larger than the spacing between reciprocal lattice rods because the incident beam has a very short wavelength due to its high-energy electrons.
[1] Figure 3 shows a cross sectional view of a single row of reciprocal lattice rods filling of the diffraction conditions.
However, interference effects between the diffracted electrons still yield strong intensities at single points on each Laue circle.
Users generally index at least 2 RHEED scans at different azimuth angles for reliable characterization of the crystal's surface structure.
[4] Figure 5 shows a schematic diagram of an electron beam incident on the sample at different azimuth angles.
[4] Rotating the sample changes the intensity of the diffracted beams due to their dependence on the azimuth angle.
[1][3] Some inelastically scattered electrons penetrate the bulk crystal and fulfill Bragg diffraction conditions.
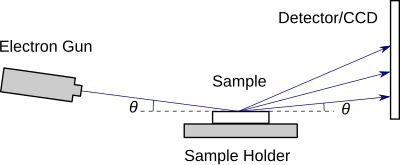
[3] In a typical RHEED setup, one magnetic and one electric field focus the incident beam of electrons.
[3] The beam is focused to the smallest possible point at the detector rather than the sample surface so that the diffraction pattern has the best resolution.
These detectors emit green light from areas where electrons hit their surface and are common to TEM as well.
Contaminants on the sample surface interfere with the electron beam and degrade the quality of the RHEED pattern.
[6] Subsequent heat treatment under the vacuum of the RHEED chamber removes the oxide layer and exposes the clean sample surface.
The RHEED system must operate at a pressure low enough to prevent significant scattering of the electron beams by gas molecules in the chamber.
The reciprocal lattice rods have a finite thickness as well, with their diameters dependent on the quality of the sample surface.
Diffraction conditions are fulfilled over the entire intersection of the rods with the sphere, yielding elongated points or ‘streaks’ along the vertical axis of the RHEED pattern.
Growing films, nucleating particles, crystal twinning, grains of varying size and adsorbed species add complicated diffraction conditions to those of a perfect surface.
In particular, RHEED is well suited for use with molecular beam epitaxy (MBE), a process used to form high quality, ultrapure thin films under ultrahigh vacuum growth conditions.
[9] The intensities of individual spots on the RHEED pattern fluctuate in a periodic manner as a result of the relative surface coverage of the growing thin film.
Figure 8 shows an example of the intensity fluctuating at a single RHEED point during MBE growth.
Video 1 depicts a metrology instrument recording the RHEED intensity oscillations and deposition rate for process control and analysis.
[10] RHEED-TRAXS analyzes X-ray spectral lines emitted from a crystal as a result of electrons from a RHEED gun colliding with the surface.
RHEED-TRAXS is preferential to X-ray microanalysis (XMA)(such as EDS and WDS) because the incidence angle of the electrons on the surface is very small, typically less than 5°.
These X-rays are then detected using a silicon-lithium Si-Li crystal placed behind beryllium windows, used to maintain vacuum.
Because of the amplification, the intensity of the electron beam can be decreased by several orders of magnitude and the damage to the samples is diminished.