Sea level
A common and relatively straightforward mean sea-level standard is instead a long-term average of tide gauge readings at a particular reference location.
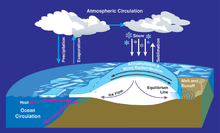
The geoid includes a significant depression in the Indian Ocean, whose surface dips as much as 106 m (348 ft) below the global mean sea level (excluding minor effects such as tides and currents).
This is because the sea is in constant motion, affected by the tides, wind, atmospheric pressure, local gravitational differences, temperature, salinity, and so forth.
For example, hourly measurements may be averaged over a full Metonic 19-year lunar cycle to determine the mean sea level at an official tide gauge.
Global MSL refers to a spatial average over the entire ocean area, typically using large sets of tide gauges and/or satellite measurements.
In unusual cases where a land location is below sea level, such as Death Valley, California, the elevation AMSL is negative.
Conversely, older volcanic islands experience relative sea level rise, due to isostatic subsidence from the weight of cooling volcanos.
The subsidence of land due to the withdrawal of groundwater is another isostatic cause of relative sea level rise.
On planets that lack a liquid ocean, planetologists can calculate a "mean altitude" by averaging the heights of all points on the surface.
Changes in ground-based ice volume also affect local and regional sea levels by the readjustment of the geoid and true polar wander.
[18]: 5, 8 Between 1993 and 2018, melting ice sheets and glaciers accounted for 44% of sea level rise, with another 42% resulting from thermal expansion of water.
[21][18][16]: 1302 In the long run, sea level rise would amount to 2–3 m (7–10 ft) over the next 2000 years if warming stays to its current 1.5 °C (2.7 °F) over the pre-industrial past.
[23][24] The sea level rise projected by 2050 will expose places currently inhabited by tens of millions of people to annual flooding.
For instance, sea level rise in the United States is likely to be two to three times greater than the global average by the end of the century.
[26][27] Yet, of the 20 countries with the greatest exposure to sea level rise, twelve are in Asia, including Indonesia, Bangladesh and the Philippines.
[29] The greatest impact on human populations in the near term will occur in low-lying Caribbean and Pacific islands including atolls.
This pressure is referred to as either QNH or "altimeter" and is transmitted to the pilot by radio from air traffic control (ATC) or an automatic terminal information service (ATIS).
Once above the transition altitude, the altimeter is set to the international standard atmosphere (ISA) pressure at MSL which is 1013.25 hPa or 29.92 inHg.


- Ocean
- Reference ellipsoid
- Local plumb line
- Continent
- Geoid