Sea surface temperature
Sea surface temperatures greatly modify air masses in the Earth's atmosphere within a short distance of the shore.
Coastal sea surface temperatures can cause offshore winds to generate upwelling, which can significantly cool or warm nearby landmasses, but shallower waters over a continental shelf are often warmer.
Onshore winds can cause a considerable warm-up even in areas where upwelling is fairly constant, such as the northwest coast of South America.
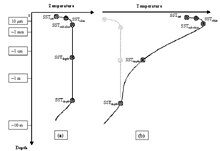
[6][7] The sea surface temperature (SST) has a diurnal range, just like the Earth's atmosphere above, though to a lesser degree due to its greater thermal inertia.
[11] Offshore of river deltas, freshwater flows over the top of the denser seawater, which allows it to heat faster due to limited vertical mixing.
In general, an SST cooling is observed after the passing of a hurricane, primarily as the result of mixed layer deepening and surface heat losses.
[13] In the wake of several day long Saharan dust outbreaks across the adjacent northern Atlantic Ocean, sea surface temperatures are reduced 0.2 C to 0.4 C (0.3 to 0.7 F).
[14] Other sources of short-term SST fluctuation include extratropical cyclones, rapid influxes of glacial fresh water[15] and concentrated phytoplankton blooms[16] due to seasonal cycles or agricultural run-off.
[3] Ocean currents, such as the Atlantic Multidecadal Oscillation, can affect sea surface temperatures over several decades.
[21]El Niño is defined by prolonged differences in Pacific Ocean surface temperatures when compared with the average value.
When El Niño conditions last for many months, extensive ocean warming and the reduction in Easterly Trade winds limits upwelling of cold nutrient-rich deep water and its economic impact to local fishing for an international market can be serious.
Among scientists, there is medium confidence that the tropical Pacific will transition to a mean pattern resembling that of El Niño on centennial time scale, but there is still high uncertainty in tropical Pacific SST projections because it is difficult to capture El Niño variability in climate models.
Benjamin Franklin suspended a mercury thermometer from a ship while travelling between the United States and Europe in his survey of the Gulf Stream in the late eighteenth century.
The first automated technique for determining SST was accomplished by measuring the temperature of water in the intake port of large ships, which was underway by 1963.
[32] Between 1985 and 1994, an extensive array of moored and drifting buoys was deployed across the equatorial Pacific Ocean designed to help monitor and predict the El Niño phenomenon.
[34] Since 1982,[35] satellites have been increasingly utilized to measure SST and have allowed its spatial and temporal variation to be viewed more fully.
First, in infrared remote sensing methodology the radiation emanates from the top "skin" of the ocean, approximately the top 0.01 mm or less, which may not represent the bulk temperature of the upper meter of ocean due primarily to effects of solar surface heating during the daytime, reflected radiation, as well as sensible heat loss and surface evaporation.
All these factors make it somewhat difficult to compare satellite data to measurements from buoys or shipboard methods, complicating ground truth efforts.
[43] Because of this temperature difference, warmth and moisture are transported upward, condensing into vertically oriented clouds which produce snow showers.
[44] Ocean temperature of at least 26.5°C (79.7°F) spanning through at minimum a 50-metre depth is one of the precursors needed to maintain a tropical cyclone (a type of mesocyclone).
[47] However, this requirement can be considered only a general baseline because it assumes that the ambient atmospheric environment surrounding an area of disturbed weather presents average conditions.
Inside a cold cyclone, 500 hPa temperatures can fall as low as −30 °C (−22 °F), which can initiate convection even in the driest atmospheres.
[52] This article incorporates public domain material from websites or documents of the National Oceanic and Atmospheric Administration.