Terrain cartography
Terrain or relief is an essential aspect of physical geography, and as such its portrayal presents a central problem in cartographic design, and more recently geographic information systems and geovisualization.
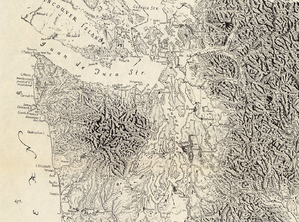
Lobeck published A Physiographic Diagram of the United States, using an advanced version of the hill profile technique to illustrate the distribution of landforms on a small-scale map.
[1] Erwin Raisz further developed, standardized, and taught this technique, which uses generalized texture to imitate landform shapes over a large area.
[2] A combination of hill profile and shaded relief, this style of terrain representation is simultaneously idiosyncratic to its creator—often hand-painted—and found insightful in illustrating geomorphological patterns.
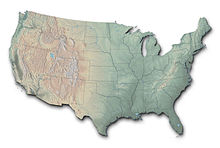
More recently, Tom Patterson developed a computer-generated technique for mapping terrain inspired by Raisz's work, called plan oblique relief.
[3] This tool starts with a shaded relief image, then shifts pixels northward proportional to their elevation.
The effect is to make mountains "stand up" and "lay over" features to the north, in the same fashion as hill profiles.
Hachures, first standardized by the Austrian topographer Johann Georg Lehmann in 1799, are a form of shading using lines.
This method was developed by Professor Tanaka Kitiro in 1950, but had been experimented with as early as 1870, with little success due to technological limitations in printing.
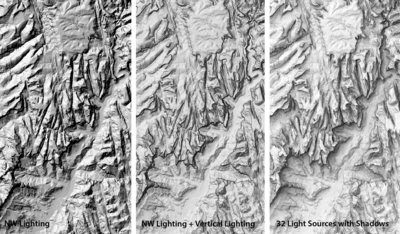
The Swiss cartographer Eduard Imhof is widely regarded as a master of manual hill-shading technique and theory.
While these relatively simple tools have made shaded relief almost ubiquitous in maps, many cartographers[weasel words] have been unhappy with the product,[which?]
and have developed techniques to improve its appearance, including the following: Imhof's contributions included a multi-color approach to shading, with purples in valleys and yellows on peaks, which is known as “illuminated shading.” Illuminating the sides of the terrain facing the light source with yellow colors provides greater realism (since direct sunlight is more yellow, and ambient light is more blue), enhances the sense of the three-dimensional nature of the terrain, and make the map more aesthetically pleasing and artistic-looking.
Resolution bumping is a hybrid technique developed by NPS cartographer Tom Patterson to mitigate this problem.
A three-dimensional view (projected onto a two-dimensional medium) of the surface of the Earth, along with the geographic features resting on it.
Hand-crafted dioramas may date back to 200BCE in China, but mass production did not become available until World War II with the invention of vacuum-formed plastic maps, and computerized machining to create molds efficiently.
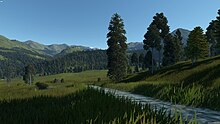
[18] Terrain rendering covers a variety of methods of depicting real-world or imaginary world surfaces.
The software application uses the CPU to identify and load terrain data corresponding to initial location from the terrain database, then applies the required transformations to build a mesh of points that can be rendered by the GPU, which completes geometrical transformations, creating screen space objects (such as polygons) that create a picture closely resembling the location of the real world.
Virtually all terrain rendering applications use level of detail to manage number of data points processed by CPU and GPU.
[19][20][21][22] Terrain rendering is widely used in computer games to represent both Earth's surface and imaginary worlds.
The Commission on Mountain Cartography of the International Cartographic Association is the best-known forum for discussion of theory and techniques for mapping these regions.


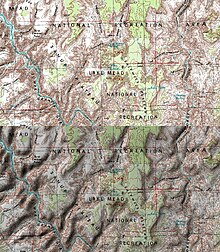
Bottom: the same map with sun shading.