Solar activity and climate
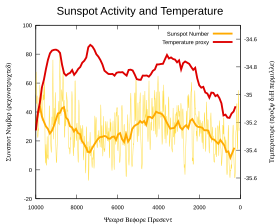
These have also been used on century times scales but, in addition, instrumental data are increasingly available (mainly telescopic observations of sunspots and thermometer measurements of air temperature) and show that, for example, the temperature fluctuations do not match the solar activity variations and that the commonly-invoked association of the Little Ice Age with the Maunder minimum is far too simplistic as, although solar variations may have played a minor role, a much bigger factor is known to be Little Ice Age volcanism.
Over time, the planet cooled and formed a solid crust, eventually allowing liquid water to exist on the surface.
There is nonetheless evidence that liquid water was already present in the Hadean[6][7] and Archean[8][6] eons, leading to what is known as the faint young Sun paradox.
[9] Hypothesized solutions to this paradox include a vastly different atmosphere, with much higher concentrations of greenhouse gases than currently exist.
[10] Over the following approximately 4 billion years, the Sun's energy output increased and the composition of the Earth atmosphere changed.
Solar irradiance before the 1970s is estimated using proxy variables, such as tree rings, the number of sunspots, and the abundances of cosmogenic isotopes such as 10Be,[12] all of which are calibrated to the post-1978 direct measurements.
Models indicate that the combination of solar variations and volcanic activity can explain periods of relative warmth and cold between A.D. 1000 and 1900.
[22] A 2010 paper suggested that a new 90-year period of low solar activity would reduce global average temperatures by about 0.3 °C, which would be far from enough to offset the increased forcing from greenhouse gases.
[23] The link between recent solar activity and climate has been quantified and is not a major driver of the warming that has occurred since early in the twentieth century.
The 2001 Intergovernmental Panel on Climate Change (IPCC) Third Assessment Report (TAR) concluded that the measured impact of recent solar variation is much smaller than the amplification effect due to greenhouse gases, but acknowledged that scientific understanding is poor with respect to solar variation.
The most likely mechanism is considered to be some combination of direct forcing by TSI changes and indirect effects of ultraviolet (UV) radiation on the stratosphere.
Based on correlations between specific climate and solar forcing reconstructions, they argued that a "realistic climate scenario is the one described by a large preindustrial secular variability (e.g., the paleoclimate temperature reconstruction by Moberg et al.)[47] with TSI experiencing low secular variability (as the one shown by Wang et al.).
[49] Stott et al. estimated that the residual effects of the prolonged high solar activity during the last 30 years account for between 16% and 36% of warming from 1950 to 1999.
[50] Neither direct measurements nor proxies of solar variation correlate well with Earth global temperature,[57] particularly in recent decades when both quantities are best known.
The total solar irradiance (TSI) panel shows the PMOD composite of observations [59] with a modelled variation from the SATIRE-T2 model of the effect of sunspots and faculae [53] with the addition of a quiet -Sun variation (due to sub-resolution photospheric features and any solar radius changes) derived from correlations with comic ray fluxes and cosmogenic isotopes.
[64][65] This is the opposite of the expected pattern if the Sun, currently closer to the Earth during austral summer, were the principal climate forcing.
[70] Scafetta and West correlated solar proxy data and lower tropospheric temperature for the preindustrial era, before significant anthropogenic greenhouse forcing, suggesting that TSI variations may have contributed 50% of the warming observed between 1900 and 2000 (although they conclude "our estimates about the solar effect on climate might be overestimated and should be considered as an upper limit.
Stott's group found that combining these factors enabled them to closely simulate global temperature changes throughout the 20th century.
They predicted that continued greenhouse gas emissions would cause additional future temperature increases "at a rate similar to that observed in recent decades".
[72] Stott's 2003 work largely revised his assessment, and found a significant solar contribution to recent warming, although still smaller (between 16 and 36%) than that of greenhouse gases.
[74] In 1991, Friis-Christensen and Lassen claimed a strong correlation of the length of the solar cycle with northern hemispheric temperature changes.
Damon and Laut claimed:[77] the apparent strong correlations displayed on these graphs have been obtained by incorrect handling of the physical data.
He showed that cycle lengths significantly diverge from Earth's temperatures and concluded that the strong correlation reported by Friis-Christensen and Lassen was an artefact of their analysis.
[97] However, not all scientists accept this correlation as statistically significant, and some who do attribute it to other solar variability (e.g. UV or total irradiance variations) rather than directly to GCR changes.
[98][99] Difficulties in interpreting such correlations include the fact that many aspects of solar variability change at similar times, and some climate systems have delayed responses.
Physicist and historian Spencer R. Weart in The Discovery of Global Warming (2003) wrote: The study of [sun spot] cycles was generally popular through the first half of the century.