Spacetime diagram
A spacetime diagram is a graphical illustration of locations in space at various times, especially in the special theory of relativity.
Spacetime diagrams can show the geometry underlying phenomena like time dilation and length contraction without mathematical equations.
Each point in a spacetime diagram represents a unique position in space and time and is referred to as an event.
Additionally, the time and space units of measurement are chosen in such a way that an object moving at the speed of light is depicted as following a 45° angle to the diagram's axes.
Especially when used in special relativity (SR), the temporal axes of a spacetime diagram are often scaled with the speed of light c, and thus are often labeled by ct.
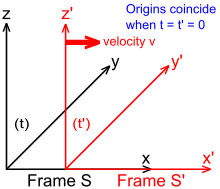
To ease insight into how spacetime coordinates, measured by observers in different reference frames, compare with each other, it is useful to standardize and simplify the setup.
In a further step of simplification it is often sufficient to consider just the direction of the observed motion and ignore the other two spatial components, allowing x and ct to be plotted in 2-dimensional spacetime diagrams, as introduced above.
The black axes labelled x and ct on Fig 1-3 are the coordinate system of an observer, referred to as at rest, and who is positioned at x = 0.
Since the reference frames are in standard configuration, both observers agree on the location of the origin of their coordinate systems.
[3] The horizontal lines correspond to the usual notion of simultaneous events for a stationary observer at the origin.
The Lorentz transformation relates two inertial frames of reference, where an observer stationary at the event (0, 0) makes a change of velocity along the x-axis.
By applying the Lorentz transformation, the spacetime axes obtained for a boosted frame will always correspond to conjugate diameters of a pair of hyperbolas.
As illustrated in Fig 2-3, the boosted and unboosted spacetime axes will in general have unequal unit lengths.
Albert Einstein announced his theory of special relativity in 1905,[7] with Hermann Minkowski providing his graphical representation in 1908.
The second diagram showed the conjugate hyperbola to calibrate space, where a similar stretching leaves the impression of FitzGerald contraction.
Since the 1960s a version of this more complete configuration has been referred to as The Minkowski Diagram, and used as a standard illustration of the transformation geometry of special relativity.
E. T. Whittaker has pointed out that the principle of relativity is tantamount to the arbitrariness of what hyperbola radius is selected for time in the Minkowski diagram.
In 1912 Gilbert N. Lewis and Edwin B. Wilson applied the methods of synthetic geometry to develop the properties of the non-Euclidean plane that has Minkowski diagrams.
This asymmetry of Minkowski diagrams can be misleading, since special relativity postulates that any two inertial reference frames must be physically equivalent.
is done in accordance with the ordinary method using tan α = β0 with respect to the orthogonal axes of the median frame (Fig.
Note that we can compare spacetime lengths on page directly with each other, due to the symmetric nature of the Loedel diagram.
Note that we can compare spacetime lengths on page directly with each other, due to the symmetric nature of the Loedel diagram.
This apparently paradoxical situation is again a consequence of the relativity of simultaneity as demonstrated by the analysis via Minkowski diagram.
It explains also the result of the Michelson–Morley experiment which was considered to be a mystery before the theory of relativity was discovered, when photons were thought to be waves through an undetectable medium.
That means any position on such a world line corresponds with steps on x- and ct-axes of equal absolute value.
On the other hand, a straight line connecting such events is always the space coordinate axis of a possible observer for whom they happen at the same time.
By a slight variation of the velocity of this coordinate system in both directions it is always possible to find two inertial reference frames whose observers estimate the chronological order of these events to be different.
Also, any general technical means of sending signals faster than light would permit information to be sent into the originator's own past.
Furthermore, if it were possible to accelerate an observer to the speed of light, their space and time axes would coincide with their angle bisector.
Fig 5-2 illustrates the changing views of spacetime along the world line of a rapidly accelerating particle.