Emission spectrum
The emission spectrum of a chemical element or chemical compound is the spectrum of frequencies of electromagnetic radiation emitted due to electrons making a transition from a high energy state to a lower energy state.
For example, visible light is emitted by the coupling of electronic states in atoms and molecules (then the phenomenon is called fluorescence or phosphorescence).
Emission of radiation is typically described using semi-classical quantum mechanics: the particle's energy levels and spacings are determined from quantum mechanics, and light is treated as an oscillating electric field that can drive a transition if it is in resonance with the system's natural frequency.
The quantum mechanics problem is treated using time-dependent perturbation theory and leads to the general result known as Fermi's golden rule.
The description has been superseded by quantum electrodynamics, although the semi-classical version continues to be more useful in most practical computations.
When the electrons fall back down and leave the excited state, energy is re-emitted in the form of a photon.
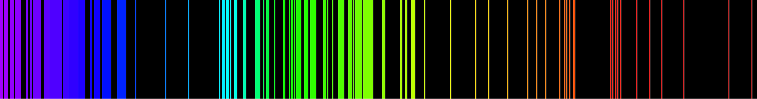
The fact that only certain colors appear in an element's atomic emission spectrum means that only certain frequencies of light are emitted.
The principle of the atomic emission spectrum explains the varied colors in neon signs, as well as chemical flame test results (described below).
Therefore, when the elements or their compounds are heated either on a flame or by an electric arc they emit energy in the form of light.
Not all emitted lights are perceptible to the naked eye, as the spectrum also includes ultraviolet rays and infrared radiation.
[1] Although the emission lines are caused by a transition between quantized energy states and may at first look very sharp, they do have a finite width, i.e. they are composed of more than one wavelength of light.
In 1756 Thomas Melvill observed the emission of distinct patterns of colour when salts were added to alcohol flames.
[5] In 1835, Charles Wheatstone reported that different metals could be distinguished by bright lines in the emission spectra of their sparks, thereby introducing an alternative to flame spectroscopy.
B. L. Foucault experimentally demonstrated that absorption and emission lines at the same wavelength are both due to the same material, with the difference between the two originating from the temperature of the light source.
[8][9] In 1853, the Swedish physicist Anders Jonas Ångström presented observations and theories about gas spectra.
At the same time George Stokes and William Thomson (Kelvin) were discussing similar postulates.
[17] The solution containing the relevant substance to be analysed is drawn into the burner and dispersed into the flame as a fine spray.
The solvent evaporates first, leaving finely divided solid particles which move to the hottest region of the flame where gaseous atoms and ions are produced through the dissociation of molecules.
Here electrons are excited as described above, and the spontaneously emit photon to decay to lower energy states.
Copper wire will create a blue colored flame, however in the presence of chloride gives green (molecular contribution by CuCl).
A warm body emitting photons has a monochromatic emission coefficient relating to its temperature and total power radiation.