Test statistic
Test statistic is a quantity derived from the sample for statistical hypothesis testing.
[1] A hypothesis test is typically specified in terms of a test statistic, considered as a numerical summary of a data-set that reduces the data to one value that can be used to perform the hypothesis test.
In general, a test statistic is selected or defined in such a way as to quantify, within observed data, behaviours that would distinguish the null from the alternative hypothesis, where such an alternative is prescribed, or that would characterize the null hypothesis if there is no explicitly stated alternative hypothesis.
An important property of a test statistic is that its sampling distribution under the null hypothesis must be calculable, either exactly or approximately, which allows p-values to be calculated.
Some informative descriptive statistics, such as the sample range, do not make good test statistics since it is difficult to determine their sampling distribution.
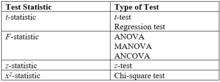
Two widely used test statistics are the t-statistic and the F-statistic.
Suppose the task is to test whether a coin is fair (i.e. has equal probabilities of producing a head or a tail).
If the coin is flipped 100 times and the results are recorded, the raw data can be represented as a sequence of 100 heads and tails.
If there is interest in the marginal probability of obtaining a tail, only the number T out of the 100 flips that produced a tail needs to be recorded.
But T can also be used as a test statistic in one of two ways: Using one of these sampling distributions, it is possible to compute either a one-tailed or two-tailed p-value for the null hypothesis that the coin is fair.
The test statistic in this case reduces a set of 100 numbers to a single numerical summary that can be used for testing.
One-sample tests are appropriate when a sample is being compared to the population from a hypothesis.
Two-sample tests are appropriate for comparing two samples, typically experimental and control samples from a scientifically controlled experiment.
Paired tests are appropriate for comparing two samples where it is impossible to control important variables.
Typically the mean of the differences is then compared to zero.
The common example scenario for when a paired difference test is appropriate is when a single set of test subjects has something applied to them and the test is intended to check for an effect.
Z-tests are appropriate for comparing means under stringent conditions regarding normality and a known standard deviation.
A t-test is appropriate for comparing means under relaxed conditions (less is assumed).
Chi-squared tests use the same calculations and the same probability distribution for different applications: F-tests (analysis of variance, ANOVA) are commonly used when deciding whether groupings of data by category are meaningful.
If the variance of test scores of the left-handed in a class is much smaller than the variance of the whole class, then it may be useful to study lefties as a group.
The null hypothesis is that two variances are the same – so the proposed grouping is not meaningful.
Proofs exist that the test statistics are appropriate.
For non-normal distributions it is possible to calculate a minimum proportion of a population that falls within k standard deviations for any k (see: Chebyshev's inequality).
• Normal population • All expected counts are at least 5.