Timeline of the 2010 Atlantic hurricane season

[1][nb 1] The season officially began on June 1, 2010, and ended on November 30, 2010, dates that conventionally delimit the period of each year when most tropical cyclones develop in the Atlantic basin.

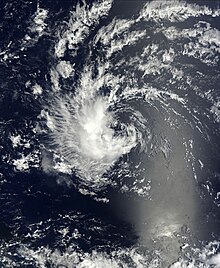
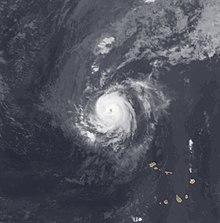
Tomas was a late-season tropical cyclone that rapidly intensified to reach maximum sustained winds of 100 mph (160 km/h) as it entered the eastern Caribbean Sea.

Though the system did not make landfall, it severely affected the Greater Antilles, and impacted the southeastern Bahamas as a tropical storm before quickly moving into the open Atlantic.

This timeline documents tropical cyclone formations, strengthening, weakening, landfalls, extratropical transitions, and dissipations during the season.

Additionally, figures for maximum sustained winds and position estimates are rounded to the nearest 5 units (knots, miles, or kilometers), following the convention used in the National Hurricane Center's products.

Satellite imagery of a mature hurricane progressing west-northwest towards the coastline of Mexico.
Hurricane Alex as a Category 1 hurricane in the Gulf of Mexico
A map depicting rainfall totals produced across the Southern United States from a weak tropical storm.
Rainfall totals from Tropical Storm Bonnie across the Southeastern United States
A satellite imagery depicting a disorganized mass of clouds across the central Atlantic.
Tropical Storm Colin near its initial peak intensity
A satellite image depicting a mature hurricane with a well-defined eye far away from landmasses.
Hurricane Danielle as a Category 4 hurricane
An image depicting the track of a powerful Atlantic hurricane.
Storm path of Hurricane Earl
A satellite image depicting the remnants of a previous tropical cyclone.
The remnants of Gaston on September 4
A satellite image depicting a well-developed tropical cyclone moving across Mexico and Texas.
Tropical Storm Hermine shortly after landfall on September 7
A satellite image depicting a mature hurricane with a well-developed eye and astounding spiral banding.
Hurricane Igor near peak intensity on September 13
An image depicting rainfall totals across Mexico.
Rainfall totals from Hurricane Karl across Mexico
A satellite image depicting a small tropical cyclone in the eastern Atlantic Ocean.
Hurricane Lisa on September 24
A satellite image depicting a well-developed tropical cyclone prior to striking Central America.
Tropical Storm Matthew near landfall
An image depicting the storm track of a short-lived tropical cyclone.
Storm path of Tropical Storm Nicole
A satellite image showing a minimal hurricane in the central Atlantic.
Hurricane Otto on October 8
A satellite image revealing a well-developed hurricane hours before landfall.
Hurricane Richard prior to landfall
A satellite image depicting a hurricane prior to becoming absorbed by a frontal boundary on October 31.
Hurricane Shary on October 31
A satellite image of a well-developed tropical cyclone entering the Caribbean Sea.
Tomas at its peak intensity while moving away from Saint Vincent and the Grenadines on October 30