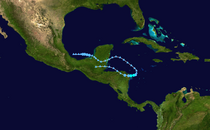
Timeline of the 2014 Atlantic hurricane season

It featured below-average tropical cyclone activity,[nb 1] with the fewest named storms since the 1997 season.

These dates, adopted by convention, historically describe the period in each year when most tropical systems form.

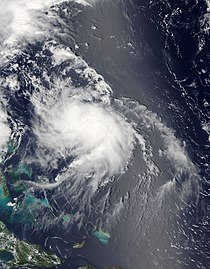
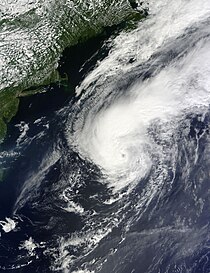
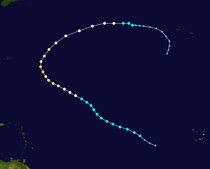
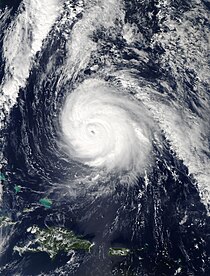
[2] The deadliest Atlantic storm of the season, Cristobal, barely touched land at all as it moved from Puerto Rico to Iceland in late August.

[2] This timeline documents tropical cyclone formations, strengthening, weakening, landfalls, extratropical transitions, and dissipations during the season.

Additionally, figures for maximum sustained winds and position estimates are rounded to the nearest 5 units (knots, miles, or kilometers), following the convention used in the National Hurricane Center's products.

A visible satellite image of a well-formed hurricane, with multiple spiral bands and an eye, nearing landfall in North Carolina on July 3, 2014.
Hurricane Arthur nearing landfall in North Carolina on July 3
A visible satellite image depicting a disorganized hurricane located northeast of the Bahamas on August 4, 2014.
Hurricane Bertha northeast of the Bahamas on August 4
A visible satellite image depicting a well-organized hurricane east of the United States on August 28, 2014.
Hurricane Cristobal near peak intensity east of the Carolinas on August 28
An image depicting the track of a long-lived 2014 tropical cyclone within the North Atlantic Basin.
Map plotting the track and the intensity of Edouard (starting at lower right corner)
A visible satellite image of a disorganized hurricane on October 12, 2014.
Hurricane Fay over the Atlantic Ocean on October 12
A visible satellite image of a well-organized hurricane at peak intensity on October 16, 2014.
Hurricane Gonzalo at peak intensity over the Atlantic Ocean on October 16
An image depicting the track of a short-lived 2014 tropical cyclone within the North Atlantic Basin.
Map plotting the track and the intensity of Hanna (starting at center left)