Tropical cyclone forecasting
The first known forecasts in the Western Hemisphere were made by Lt. Col. William Reed of the Corps of Royal Engineers at Barbados in 1847.
Benito Vines introduced a forecast and warning system based on cloud cover changes in Havana during the 1870s.
It wasn't until the advent of radio in the early twentieth century that observations from ships at sea were available to forecasters.
[1] In the late 1970s, William Gray noticed a trend of low hurricane activity in the North Atlantic basin during El Niño years.
He found numerous factors across the globe influence tropical cyclone activity, such as connecting wet periods over the African Sahel to an increase in major hurricane landfalls along the United States East Coast.
[4] Students and colleagues joined his forecast team in the following years, including Christopher Landsea, Paul W. Mielke Jr., and Kenneth J.
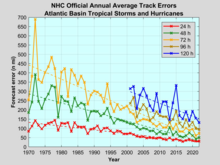
[6] Because of the forces that affect tropical cyclone tracks, accurate track predictions depend on determining the position and strength of high- and low-pressure areas and predicting how those areas will change during the life of a tropical system.
[8] The 1-2-3 rule itself refers to the rounded long-term NHC/TPC forecast errors of 100-200-300 nautical miles at 24-48-72 hours, respectively.
[11] Available computing power limits forecasters' ability to accurately model a large number of complex factors, such as exact topology and atmospheric conditions, though with increased experience and understanding, even models with the same resolution can be tuned to more accurately reflect real-world behaviour.
The Cyclone Global Navigation Satellite System, launched by NASA in 2016, is expected to provide much more data compared to sporadic measurements by weather buoys and hurricane-penetrating aircraft.
[13] An accurate track forecast is essential to creating accurate intensity forecasts, particularly in an area with large islands such as the western north Pacific and the Caribbean Sea, as proximity to land is an inhibiting factor to developing tropical cyclones.
[14] Dr. Kerry Emanuel created a mathematical model around 1988, called the maximum potential intensity or MPI, to compute the upper limit of tropical cyclone intensity based on sea surface temperature and atmospheric profiles from the latest global model runs.
Maps created from this equation show values of the maximum achievable intensity due to the thermodynamics of the atmosphere at the time of the last model run (either 0000 or 1200 UTC).
, the graph generated by this function corresponds to the 99th percentile of empirical tropical cyclone intensity data.
The presence of topography near the coast, as is the case across much of Mexico, Haiti, the Dominican Republic, much of Central America, Madagascar, Réunion, China, and Japan acts to magnify amounts due to upslope flow into the mountains.
[20] However, as a result of global warming, the heat that has built up on the ocean's surface has allowed storms and hurricanes to capture more water vapour and, given the increased temperatures in the atmosphere also, retain the moisture for a longer capacity.
At that time the United States Department of Defense was using paper maps, acetate, grease pencils, and disparate computer programs to forecast tropical cyclones.
[22] The Automated Tropical Cyclone Forecasting System (ATCF) software was developed by the Naval Research Laboratory for the Joint Typhoon Warning Center (JTWC) beginning in 1986,[23] and used since 1988.
[23][24] This provided the NHC with a multitasking software environment which allowed them to improve efficiency and cut the time required to make a forecast by 25% or 1 hour.
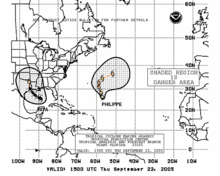
However, if the landfall point is uncertain, a maximum envelope of water (MEOW) map can be generated based on the direction of approach.
By looking at annual variations in various climate parameters, forecasters can make predictions about the overall number and intensity of tropical cyclones that will occur in a given season.