Unemployment in the United Kingdom
This was largely unchanged compared with the previous three-month period and 1.1 percentage points lower than before the pandemic (December 2019 to February 2020).
For example, a person who wants a job but is not available for work due to sickness or disability would be classed as economically inactive, not unemployed.
[9] Data consistent with current international definitions is not available for years before 1971 due to there not being a Labour Force Survey before this time.
There is some data available on UK unemployment rates from before 1971 but it is not consistent with the current international definitions as it is more closely related to the Claimant Count.
Despite the weakening job market, wage growth remained strong at 6%, outpacing inflation with a 2.9% real-terms increase.
Economists noted uncertainties in the ONS unemployment figures due to changes in the labour force survey.
HM Revenue & Customs data also indicated a cooling job market, with payroll employment dropping by 3,000 and a rise in economic inactivity to 22.3%.
[10] The headline unemployment figure arising from the official definition differs from the "Claimant Count" which is published alongside it.
[12] More information on the differences between the official headline unemployment figure and the Claimant Count is in this document.
In addition, there was a significant rise in enclosure during the Tudor period, limiting the land available for people to work on.
In 1535, a bill was drawn up calling for the creation of a system of public works to deal with the problem of unemployment, to be funded by a tax on income and capital.
[14] In 1547, a bill was passed that subjected vagrants to some of the more extreme provisions of the criminal law, namely two years' servitude and branding with a "V" as the penalty for the first offence and death for the second.
Under the Poor Law systems of England and Wales, Scotland and Ireland a workhouse was a place where people who were unable to support themselves, could go to live and work.
In France and Britain by the end of the century, an estimated 10 per cent of the people depended on charity or begging for their food.
This means the unemployment rates for this period are based on a very small section of the UK population at the time (mainly manual workers).
[19] However, only a limited number of people could be insured, the act of 1911 only included around 2.25 million manual workers aged 16 years and over who were deemed to be working in an industry where employment was insecure.
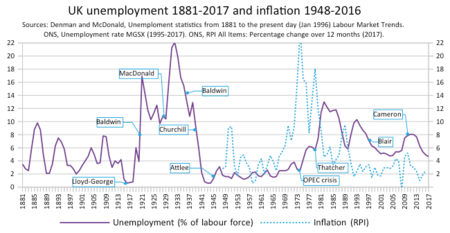
Considering the data based on this expansion, the highest recorded unemployment rate between 1916 and 1920 was 6.6% in December 1919 and the lowest was 2.6% in June 1920 (excluding the war years).
Considering the data between 1920 and 1948 the highest recorded unemployment rate was 23.4% in May 1921 and the lowest was 1.6% in September 1947 (excluding the war years).
This count is still published today alongside the headline unemployment figure which is based on the Labour Force Survey.
[21] More information on the difference between the claimant count and the headline measure of unemployment is in this pdf Archived 17 July 2021 at the Wayback Machine.
[22] Most of these jobs had been lost in the heavy industry sector,[23] which was in decline, with the government's monetarist policies to tackle inflation also being blamed for the economic downturn and subsequent mass unemployment, which was particularly severe in Scotland, Northern Ireland, the north of England, and in South Wales.
[25] Later in the decade, the government began instructing doctors with the National Health Service to find ways where they could to diagnose unemployed patients with illnesses or injuries resulting from their previous work so they could receive sickness or invalidity benefit and thus no longer be considered unemployed.
[22] In spite of overseeing the highest unemployment figures seen in Britain for half a century, Margaret Thatcher's Conservative government was re-elected at the general elections of 1983 and 1987.
The economic situation of the UK improved after 1992, however, and the official unemployment level fell below 2 million by 1997 with the rate standing at around 6.8%, with inflation also remaining low.
There was a slight rise in unemployment during 2005 and 2006, as the workforce expanded partly due to increased immigration (mostly from the Eastern European states which had just joined the European Union), and as a result of a decline in manufacturing, with the West Midlands of England being particularly hard hit by the collapse of MG Rover in Birmingham in 2005 and Peugeot's decision to close its Ryton plant near Coventry the following year.
The rate and level then both began to fall slightly for a while before both rising again to reach 2.6 million and 8.3%, respectively, by the end of 2011, largely due to public sector job losses resulting from the Conservative-led government's spending cuts.
[40] The number of jobless people who are available to work but not seeking it is not published by the Office for National Statistics on a monthly basis but it is available in some Eurostat publications.
[citation needed] Figures on those people seeking work but not immediately available to start are not published in the monthly labour market bulletin but they are available in some Eurostat publications.
[41] A measure of the potential additional labour force in the UK The Office for National Statistics publishes monthly figures on the number of economically inactive people who want a job but who are not included in the unemployment figures either because they did not actively seek work in the 4 weeks previous to the survey date or because they are not available to start work within the 2 weeks following the survey date.
Eurostat uses the European Union Labour Force Survey, which collects quarterly data for all member states.