Univariate (statistics)
Univariate is a term commonly used in statistics to describe a type of data which consists of observations on only a single characteristic or attribute.
[2] Some univariate data consists of numbers (such as the height of 65 inches or the weight of 100 pounds), while others are nonnumerical (such as eye colors of brown or blue).
[2] A numerical univariate data is discrete if the set of all possible values is finite or countably infinite.
The first one is to answer a research question with descriptive study and the second one is to get knowledge about how attribute varies with individual effect of a variable in regression analysis.
It is used to estimate the central location of the univariate data by the calculation of mean, median and mode.
The mean has the advantage that its calculation includes each value of the data set, but it is particularly susceptible to the influence of outliers.
Using more than one of these measures provides a more accurate descriptive summary of central tendency for the univariate.
For interval and ratio level data, further descriptors include the variable's skewness and kurtosis.
[11] For a nominal variable a one-way chi-square (goodness of fit) test can help determine if our sample matches that of some population.
[12] For interval and ratio level data, a one-sample t-test can let us infer whether the mean in our sample matches some proposed number (typically 0).
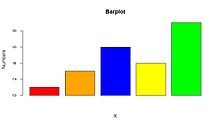
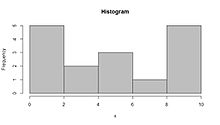
The most frequently used graphical illustrations for univariate data are: Frequency is how many times a number occurs.
The length or height of bars gives a visual representation of the proportional differences among categories.
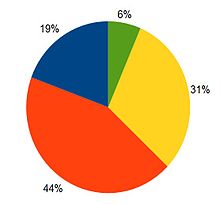
[13] Pie chart is a circle divided into portions that represent the relative frequencies or percentages of a population or a sample belonging to different categories.