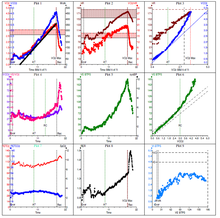
Wasserman 9-Panel Plot
The Wasserman 9-Panel Plot, often called a Nine-Panel Plot, is a standard layout for the graphical representation of data produced by a cardiopulmonary exercise test.
The graphs give an overview of cardiovascular, ventilatory, and gas exchange parameters.
[2] The Wasserman 9-Panel Plot is named for American physiologist Professor Karlman Wasserman M.D.
[3] Professor Wasserman worked extensively on pulmonary physiology, and also described the "gear wheel model" used for explaining results obtained from the test.
This medical diagnostic article is a stub.