White light interferometry
As described here, white light interferometry is a non-contact optical method for surface height measurement on 3D structures with surface profiles varying between tens of nanometers and a few centimeters.
Yuri Denisyuk and Emmett Leith, have done much in the area of white light holography and interferometry.
[8] Here the vertical scanning or coherence probe interferometers are discussed in detail due to their extensive use for surface metrology in today’s high-precision industrial applications.
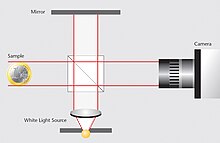
A broadband “white light” source is used to illuminate the test and reference surfaces.
The returning beams are relayed by the beam splitter to the CCD image sensor, and form an interference pattern of the test surface topography that is spatially sampled by the individual CCD pixels.
A test surface having features of different heights leads to a phase pattern that is mixed with the light from the flat reference in the CCD image sensor plane.
Each pixel of the CCD samples a different spatial position within the image of the test surface.
A typical white light correlogram (interference signal) is produced when the length of the reference or measurement arm is scanned by a positioning stage through a path length match.
A matrix with the height values of the object surface can be derived by determining the z-values of the positioning stage where the modulation is greatest for every pixel.
The lateral positions of the height values depend on the corresponding object point that is imaged by the pixel matrix.
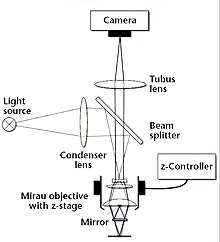
On the front lens there is a miniaturized mirror the same size as the illuminated surface on the object.
Moving the interference objective modifies the length of the measurement arm.
Therefore, the quality and shape of the correlogram have a major influence on the system’s resolution and accuracy.
The most important features of the light source are its wavelength and coherence length.
The coherence length determines the width of the correlogram, which relies on the spectral width of the light source, as well as on structural aspects such as the spatial coherence of the light source and the numerical aperture (NA) of the optical system.
The following discussion assumes that the dominant contribution to the coherence length is the emission spectrum.
In Figure 4, you can see the spectral density function for a Gaussian spectrum, which is, for example, a good approximation for a light emitting diode (LED).
The corresponding intensity modulation is shown to be substantial only in the neighborhood of position z0 where the reference and object beams have the same length and superpose coherently.
The z-range of the positioning stage in which the envelope of intensity modulation is higher than 1/e of the maximum value determines the correlogram width.
According to the generalized Wiener–Khinchin theorem, the autocorrelation function of the light field is given by the Fourier transformation of the spectral density:
(2) which is measured by interfering the light field of reference and object beams.
can be expressed by the central wavelength, and the effective bandwidth by means of the coherence length,
For every pixel the correlogram is sampled with a defined z-displacement step size.
In interference microscopy using white light, a more complete description of signal generation includes additional parameters related to spatial coherence.
The principle of the envelope calculation is to remove the cosine term of equation 4.
The envelope is obtained by summing the powers of the cosine and sine-modulated correlograms:
Two slightly different algorithms are implemented for the calculation of the envelope maximum.
The first algorithm is used to evaluate the envelope of the correlogram; the z-value is derived from the maximum.
The uncertainty of the calculation of the envelope maximum depends on: the coherence length, the sampling step size of the correlogram, deviations of the z-values from desired values (e.g. due to vibrations), the contrast and the roughness of the surface.
The best results are obtained with a short coherence length, a small sampling step size, good vibration isolation, high contrast and smooth surfaces.