Absorption spectroscopy
The source, sample arrangement and detection technique vary significantly depending on the frequency range and the purpose of the experiment.
Radiation is more likely to be absorbed at frequencies that match the energy difference between two quantum mechanical states of the molecules .
The frequencies at which absorption lines occur, as well as their relative intensities, primarily depend on the electronic and molecular structure of the sample.
A liquid or solid absorber, in which neighboring molecules strongly interact with one another, tends to have broader absorption lines than a gas.
A transmission spectrum will have its maximum intensities at wavelengths where the absorption is weakest because more light is transmitted through the sample.
The scattering and reflection spectra of a material are influenced by both its refractive index and its absorption spectrum.
[6] The specificity also allows unknown samples to be identified by comparing a measured spectrum with a library of reference spectra.
Infrared spectra, for instance, have characteristics absorption bands that indicate if carbon-hydrogen or carbon-oxygen bonds are present.
The absorption coefficient for some compounds is available from reference sources, and it can also be determined by measuring the spectrum of a calibration standard with a known concentration of the target.
One of the unique advantages of spectroscopy as an analytical technique is that measurements can be made without bringing the instrument and sample into contact.
For example, measurements can be made in toxic or hazardous environments without placing an operator or instrument at risk.
Some ground-based methods provide the possibility to retrieve tropospheric and stratospheric trace gas profiles.
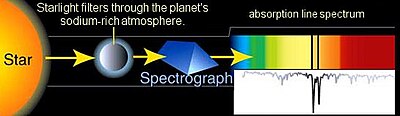
In this case, the objects and samples of interest are so distant from earth that electromagnetic radiation is the only means available to measure them.
Its discovery spurred and guided the development of quantum electrodynamics, and measurements of the Lamb shift are now used to determine the fine-structure constant.
Examples of these include globars or other black body sources in the infrared, mercury lamps in the visible and ultraviolet, and X-ray tubes.
Other radiation sources generate a narrow spectrum, but the emission wavelength can be tuned to cover a spectral range.
Examples of detectors common in spectroscopy include heterodyne receivers in the microwave, bolometers in the millimeter-wave and infrared, mercury cadmium telluride and other cooled semiconductor detectors in the infrared, and photodiodes and photomultiplier tubes in the visible and ultraviolet.
If both the source and the detector cover a broad spectral region, then it is also necessary to introduce a means of resolving the wavelength of the radiation in order to determine the spectrum.
It is also common to employ interferometry to determine the spectrum—Fourier transform infrared spectroscopy is a widely used implementation of this technique.
Two other issues that must be considered in setting up an absorption spectroscopy experiment include the optics used to direct the radiation and the means of holding or containing the sample material (called a cuvette or cell).
For instance, in several wavelength ranges it is necessary to measure the sample under vacuum or in a noble gas environment because gases in the atmosphere have interfering absorption features.