Climate change in Antarctica
[3] The warming of the Southern Ocean around Antarctica has caused the weakening or collapse of ice shelves, which float just offshore of glaciers and stabilize them.
By 2100, net ice loss from Antarctica is expected to add about 11 cm (5 in) to global sea level rise.
Marine ice sheet instability may cause West Antarctica to contribute tens of centimeters more if it is triggered before 2100.
[8][9][10] The fresh, 1100–1500 billion tons (GT) per year of meltwater from the ice dilutes the saline Antarctic bottom water,[11][12] weakening the lower cell of the Southern Ocean overturning circulation (SOOC).
[7]: 1240 According to some research, a full collapse of the SOOC may occur at between 1.7 °C (3.1 °F) and 3 °C (5.4 °F) of global warming,[13] although the full effects are expected to occur over multiple centuries; these include less precipitation in the Southern Hemisphere but more in the Northern Hemisphere, an eventual decline of fisheries in the Southern Ocean and a potential collapse of certain marine ecosystems.
[23] The complete melting and disappearance of the East Antarctic ice sheet would require at least 10,000 years and would only occur if global warming reaches 5 °C (9.0 °F) to 10 °C (18 °F).
Automatic weather stations were deployed relatively late, and their observational record was brief for much of the 20th century satellite temperature measurements began in 1981 and are typically limited to cloud-free conditions.
[43] Relatively few scientists responded to the book at the time,[44] but it was mentioned in a 2006 US Senate hearing in support of climate change denial.
[49] During 2012–2013, estimates based on WAIS Divide ice cores and revised temperature records from Byrd Station suggested a much-larger West-Antarctica warming of 2.4 °C (4.3 °F) since 1958, or around 0.46 °C (0.83 °F) per decade,[50][51][52][53] although there has been uncertainty about it.
[54] In 2022, a study narrowed the warming of the Central area of the West Antarctic Ice Sheet between 1959 and 2000 to 0.31 °C (0.56 °F) per decade, and conclusively attributed it to increases in greenhouse gas concentrations caused by human activity.
[55] Between 2000 and 2020, local changes in atmospheric circulation patterns like the Interdecadal Pacific Oscillation (IPO) and the Southern Annular Mode (SAM) slowed or partially reversed the warming of West Antarctica , with the Antarctic Peninsula experiencing cooling from 2002.
[76][74] Some of this was due to the natural cycle of Interdecadal Pacific Oscillation (IPO) but there is a clear effect of climate change,[77][78] because it alters winds and precipitation through shifts in the Southern Annular Mode (SAM) pattern.
[7]: 1240 During the 2010s, a temporary reduction in ice-shelf melting in West Antarctica allowed for the partial recovery of Antarctic bottom water and the lower cell of the circulation.
[82] As with the better-studied Atlantic meridional overturning circulation (AMOC), a major slowing or collapse of the SOOC would have substantial regional and global effects.
[84] A 2021 analysis of data from four research satellite systems – Envisat, European Remote-Sensing Satellite, GRACE and GRACE-FO, and ICESat – indicated an annual mass loss of about 12 Gt from 2012 to 2016 due to much-greater ice gain in East Antarctica than earlier estimated, which offset most of the losses from West Antarctica.
If it reaches Antarctica, black carbon accumulates on snow and ice, reducing the reflectivity and causing it to absorb more energy.
[90][86] Black carbon deposits near common tourist sites and research stations increase summer seasonal melting by between about 5 to 23 kg (11 to 51 lb) of snow per m2.
[8][9][10] According to one study, if the Paris Agreement is followed and global warming is limited to 2 °C (3.6 °F), the loss of ice in Antarctica will continue at the 2020 rate for the rest of the 21st century, but if a trajectory leading to 3 °C (5.4 °F) is followed, Antarctica ice loss will accelerate after 2060 and start adding 0.5 cm (0.20 in) per year to global sea levels by 2100.
[96] This kind of collapse is now considered almost inevitable because it appears to have occurred during the Eemian period 125,000 years ago, when temperatures were similar to those in the early 21st century.
[20] Other researchers said a climate engineering intervention to stabilize the ice sheet's glaciers may delay its loss by centuries and give the environment more time to adapt.
[23] Evidence from the Pleistocene shows partial loss can occur at lower warming levels; Wilkes Basin is estimated to have lost enough ice to add 0.5 m (1 ft 8 in) to sea levels between 115,000 and 129,000 years ago during the Eemian, and about 0.9 m (2 ft 11 in) between 318,000 and 339,000 years ago during Marine Isotope Stage 9.
[103] The permafrost in Antarctica traps various compounds, including persistent organic pollutants (POPs) like polycyclic aromatic hydrocarbons, many of which are known carcinogens or can cause liver damage;[104] and polychlorinated biphenyls such as hexachlorobenzene (HCB) and DDT, which are associated with decreased reproductive success and immunohematological disorders.
[105] Antarctic soils also contain heavy metals, including mercury, lead and cadmium, all of which can cause endocrine disruption, DNA damage, immunotoxicity and reproductive toxicity.
Without a reversal in temperature increases, baleen whales are likely to be forced to adapt their migratory patterns or face local extinction.
[111]: 2327 Gentoo penguins, which are ice intolerant and use mosses as nesting material, have been able to spread into previously inaccessible territories and substantially increase in number.
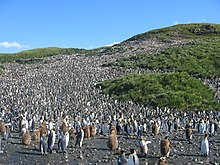
[120] Under the worst-case warming scenario, king penguins will permanently lose at least two of their current eight breeding sites, and 70% of the species (1.1 million pairs) will have to relocate to avoid extinction.
[126] It is estimated while Adélie penguins will retain some habitat past 2099, one-third of colonies along the West Antarctic Peninsula – around 20% of the species – will be in decline by 2060.
[130] The Antarctic ozone hole has led to an increase in UV-B radiation, which also causes observed damage to plant cells and photosynthesis.
[86][133] The development of Antarctica for the purposes of industry, tourism, and an increase in research facilities may put pressure on the continent and threaten its status as largely untouched land.
Designation of ASPAs has decreased 84% since the 1980s despite a rapid increase in tourism, which may bring additional stressors to the natural environment and ecosystems.