Auger electron spectroscopy
Auger electron spectroscopy (AES; pronounced [oʒe] in French) is a common analytical technique used specifically in the study of surfaces and, more generally, in the area of materials science.
[1] Until the early 1950s Auger transitions were considered nuisance effects by spectroscopists, not containing much relevant material information, but studied so as to explain anomalies in X-ray spectroscopy data.
Since 1953 however, AES has become a practical and straightforward characterization technique for probing chemical and compositional surface environments and has found applications in metallurgy, gas-phase chemistry, and throughout the microelectronics industry.
[3][8] Since orbital energies are unique to an atom of a specific element, analysis of the ejected electrons can yield information about the chemical composition of a surface.
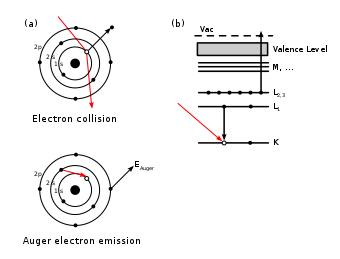
Because of the interaction between an electron's spin and orbital angular momentum (spin-orbit coupling) and the concomitant energy level splitting for various shells in an atom, there are a variety of transition pathways for filling a core hole.
Fortunately, the strongest electron-electron interactions are between levels that are close together, giving rise to characteristic peaks in an Auger spectrum.
[7] Because of the low energy of Auger electrons, most AES setups are run under ultra-high vacuum (UHV) conditions.
These secondary peaks, not to be confused with high energy satellites, which are discussed later, arise from the presence of the same element in multiple different chemical states on a surface (i.e. Adsorbate layers) or from relaxation transitions involving valence band electrons of the substrate.
Figure 3 illustrates a derivative spectrum from a copper nitride film clearly showing the Auger peaks.
[7] Semi-quantitative compositional and element analysis of a sample using AES is dependent on measuring the yield of Auger electrons during a probing event.
[4][6] Since the Auger effect is not the only mechanism available for atomic relaxation, there is a competition between radiative and non-radiative decay processes to be the primary de-excitation pathway.
The total transition rate, ω, is a sum of the non-radiative (Auger) and radiative (photon emission) processes.
[6] Attempts to relate the fluorescence and Auger yields to atomic number have resulted in plots similar to figure 4.
Lithium represents the lower limit for AES sensitivity since the Auger effect is a "three state" event necessitating at least three electrons.
Early approximations (in cm2) of the cross-section were based on the work of Worthington and Tomlin, with b acting as a scaling factor between 0.25 and 0.35, and C a function of the primary electron beam energy,
Thus the total yield can be written as: Here Nx is the number of x atoms per volume, λ the electron escape depth, θ the analyzer angle, T the transmission of the analyzer, I(t) the electron excitation flux at depth t, dΩ the solid angle, and δt is the thickness of the layer being probed.
Encompassed in these terms, especially the Auger yield, which is related to the transition probability, is the quantum mechanical overlap of the initial and final state wave functions.
Precise expressions for the transition probability, based on first-order perturbation Hamiltonians, can be found in Thompson and Baker.
Ratios of the acquired data to standards can eliminate common terms, especially experimental setup characteristics and material parameters, and can be used to determine element composition.
The intensity map is correlated to a gray scale on a monitor with whiter areas corresponding to higher element concentration.
Precise depth milling through sputtering has made profiling an invaluable technique for chemical analysis of nanostructured materials and thin films.
In general, as a molecule becomes more protonated, the ionization potentials increase and the kinetic energy of the emitted outer shell electrons decreases.
[17] Despite the advantages of high spatial resolution and precise chemical sensitivity attributed to AES, there are several factors that can limit the applicability of this technique, especially when evaluating solid specimens.
Both positive and negative surface charges severely alter the yield of electrons emitted from the sample and hence distort the measured Auger peaks.
Several processes have been developed to combat the issue of charging, though none of them is ideal and still make quantification of AES data difficult.
A related technique involves thinning or "dimpling" a non-conductive layer with Ar+ ions and then mounting the sample to a conductive backing prior to AES.
[18][19] This method has been debated, with claims that the thinning process leaves elemental artifacts on a surface and/or creates damaged layers that distort bonding and promote chemical mixing in the sample.
[2][5][6] In addition to charging effects, AES data can be obscured by the presence of characteristic energy losses in a sample and higher order atomic ionization events.
For such spectra, additional analysis through chemical sensitive surface techniques like x-ray photoelectron spectroscopy (XPS) is often required to disentangle the peaks.
[20] Despite these sometimes substantial drawbacks, Auger electron spectroscopy is a widely used surface analysis technique that has been successfully applied to many diverse fields ranging from gas phase chemistry to nanostructure characterization.