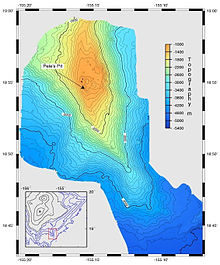
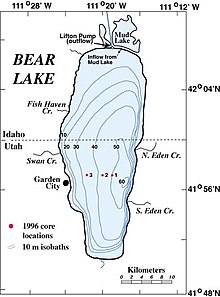
Bathymetric chart
A bathymetric chart is a type of isarithmic map that depicts the submerged bathymetry and physiographic features of ocean and sea bottoms.
[4] These accounts show a heightened awareness of regional depths and seafloor characteristics among ancient mariners and demonstrate that discoveries in bathymetry and the use of bathymetric charts had progressed significantly.
His publication provided the groundwork for future mariners and inventors to continue to develop new and inventive ways to produce high quality charts and surveys of the world's lakes and oceans.
Simply put, the bathymetric chart is intended to show the land if overlying waters were removed in exactly the same manner as the topographic map.
They differ slightly from the surveys required to create the product of hydrography in its more limited application and as conducted by the national and international agencies tasked with producing charts and publications for safe navigation.
The data used to make bathymetric maps today typically comes from an echosounder (sonar) mounted beneath or over the side of a boat, "pinging" a beam of sound downward at the seafloor or from remote sensing LIDAR or LADAR systems.
In general, a wide swath, which is depth dependent, allows a boat to map more seafloor in less time than a single-beam echosounder by making fewer passes.
The beams update many times per second (typically 0.1–50 Hz depending on water depth), allowing faster boat speed while maintaining 100% coverage of the seafloor.
As of 2010[update] a number of different outputs are generated, including a sub-set of the original measurements that satisfy some conditions (e.g., most representative likely soundings, shallowest in a region, etc.)
Historically, selection of measurements was more common in hydrographic applications while DTM construction was used for engineering surveys, geology, flow modeling, etc.
Satellite radar maps deep-sea topography by detecting the subtle variations in sea level caused by the gravitational pull of undersea mountains, ridges, and other masses.
[10] For deep-water bathymetry, this is typically Mean Sea Level (MSL), but most data used for nautical charting is referenced to Mean Lower Low Water (MLLW) in American surveys, and Lowest Astronomical Tide (LAT) in other countries.
The taking and analysis of bathymetric measurements is one of the core areas of modern hydrography, and a fundamental component in ensuring the safe transport of goods worldwide.