Greenhouse gas emissions
Carbon dioxide (CO2), from burning fossil fuels such as coal, oil, and natural gas, is the main cause of climate change.
[31] Starting about 1750, industrial activity powered by fossil fuels began to significantly increase the concentration of carbon dioxide and other greenhouse gases.
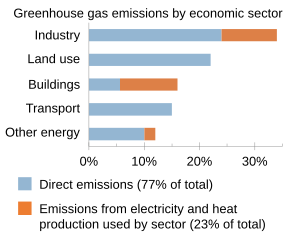
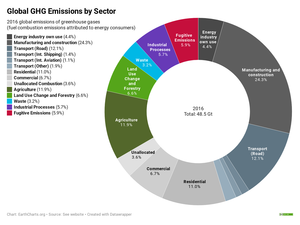
[43] In 2019, approximately 34% [20 GtCO2-eq] of total net anthropogenic GHG emissions came from the energy supply sector, 24% [14 GtCO2-eq] from industry, 22% [13 GtCO2-eq] from agriculture, forestry and other land use (AFOLU), 15% [8.7 GtCO2-eq] from transport and 6% [3.3 GtCO2-eq] from buildings.
[46][47] China is, by a significant margin, Asia's and the world's largest emitter: it emits nearly 10 billion tonnes each year, more than one-quarter of global emissions.
A positive account balance would mean that more production was occurring within a country, so more operational factories would increase carbon emission levels.
[15] Cumulative anthropogenic (i.e., human-emitted) emissions of CO2 from fossil fuel use are a major cause of global warming,[72] and give some indication of which countries have contributed most to human-induced climate change.
[61]: 179–80 Over this time period, the US accounted for 28% of emissions; the EU, 23%; Japan, 4%; other OECD countries 5%; Russia, 11%; China, 9%; India, 3%; and the rest of the world, 18%.
[81] Buildings, like industry, are directly responsible for around one-fifth of greenhouse gas emissions, primarily from space heating and hot water consumption.
[56]: 93–94 The actual calculation of net emissions is very complex, and is affected by how carbon sinks are allocated between regions and the dynamics of the climate system.
Greenhouse gas emissions are measured in CO2 equivalents determined by their global warming potential (GWP), which depends on their lifetime in the atmosphere.
[94] While mitigation measures for decarbonization are essential on the longer term, they could result in weak near-term warming because sources of carbon emissions often also co-emit air pollution.
[105] Emissions may be mitigated by upgrading coke ovens, installing particulate filters on diesel-based engines, reducing routine flaring, and minimizing open burning of biomass.
[114] In the 2022 IPCC report, it is noted that providing modern energy services universally would only increase greenhouse gas emissions by a few percent at most.
In 1997, human-caused Indonesian peat fires were estimated to have released between 13% and 40% of the average annual global carbon emissions caused by the burning of fossil fuels.
"[148][149][150] Jet airliners contribute to climate change by emitting carbon dioxide (CO2), nitrogen oxides, contrails and particulates.In 2018, global commercial operations generated 2.4% of all CO2 emissions.
Retrofitting existing buildings to become more efficient will be necessary to meet the targets of the Paris Agreement; it will be insufficient to only apply low-emission standards to new construction.
Low-energy buildings are designed to be highly efficient with low total energy consumption and carbon emissions—a popular type is the passive house.
[156] Green building practices that avoid emissions or capture the carbon already present in the environment, allow for reduced footprint of the construction industry, for example, use of hempcrete, cellulose fiber insulation, and landscaping.
Its contribution to greenhouse gases has declined by three-quarters in absolute terms since a peak in the 1970s of approximately 110 million metric tons/year, and in 2004 accounted for about 1/2 of one percent of all anthropogenic carbon dioxide emissions.
CO2 emitted from steel production primarily comes from energy consumption of fossil fuel as well as the use of limestone to purify iron oxides.
In 2018 research claimed that some of the most common plastics in the environment release the greenhouse gases methane and ethylene when exposed to sunlight in an amount that can affect the earth climate.
By 2050, the life cycle emissions of plastics could reach 56 billion tonnes, as much as 14 percent of the Earth's remaining carbon budget.
The study estimated for the worst-case scenario, that CT electricity usage could contribute up to 23% of the globally released greenhouse gas emissions in 2030.
The goal of such assessments is to cover the full life of the source, from material and fuel mining through construction to operation and waste management.
Fueled by the consumptive lifestyle of wealthy people, the wealthiest 5% of the global population has been responsible for 37% of the absolute increase in greenhouse gas emissions worldwide.
[202][203] Variations in regional, and national per capita emissions partly reflect different development stages, but they also vary widely at similar income levels.
[204][205] According to a 2020 report by Oxfam and the Stockholm Environment Institute,[206][207] the richest 1% of the global population have caused twice as much carbon emissions as the poorest 50% over the 25 years from 1990 to 2015.
Based on a study in 32 developed countries, researchers found that "seniors in the United States and Australia have the highest per capita footprint, twice the Western average.
[220][221] In October 2023, the US Energy Information Administration (EIA) released a series of projections out to 2050 based on current ascertainable policy interventions.
[243] India emits about 3 gigatonnes (Gt) CO2eq of greenhouse gases each year; about two tons per person,[244] which is half the world average.