Causal notation
Establishing causal relationships is the aim of many scientific studies across fields ranging from biology[1] and physics[2] to social sciences and economics.
[3] It is also a subject of accident analysis,[4] and can be considered a prerequisite for effective policy making.
To describe causal relationships between phenomena, non-quantitative visual notations are common, such as arrows, e.g. in the nitrogen cycle or many chemistry[5][6] and mathematics[7] textbooks.
Mathematical conventions are also used, such as plotting an independent variable on a horizontal axis and a dependent variable on a vertical axis,[8] or the notation
[9] Causal relationships are also described using quantitative mathematical expressions.
denote two quantities with an a priori unknown causal relationship, which can be related by a mathematical expression.
Imagine the number of days of weather below one degrees Celsius,
and vice versa, one can write an equation relating
This equation may be used to successfully calculate the number of hibernating bears
, given the surface area of the lake covered by ice.
However, melting the ice in a region of the lake by pouring salt onto it, will not cause bears to come out of hibernation.
Nor will waking the bears by physically disturbing them cause the ice to melt.
Suppose an ideal solar-powered system is built such that if it is sunny and the sun provides an intensity
represents the acceleration due to Earth's gravity (
In this example, the fact that it is sunny and there is a light intensity
) will not result in turning on the sun to illuminate the solar panel (an increase in
to describe an equivalent carcinogenicity between how many cigarettes a person smokes,
Consider a barter-based economy where the number of cows
one owns has value measured in a standard currency of chickens,
by offering them 4 cows, will eventually lead to an increase in their number of barrels of oil
It is standard to draw “harpoon-type” arrows in place of an equals sign, ⇌, to denote the reversible nature of the reaction and the dynamic causal relationship between reactants and products.
[5][6] Do-calculus, and specifically the do operator, is used to describe causal relationships in the language of probability.
A causal diagram consists of a set of nodes which may or may not be interlinked by arrows.
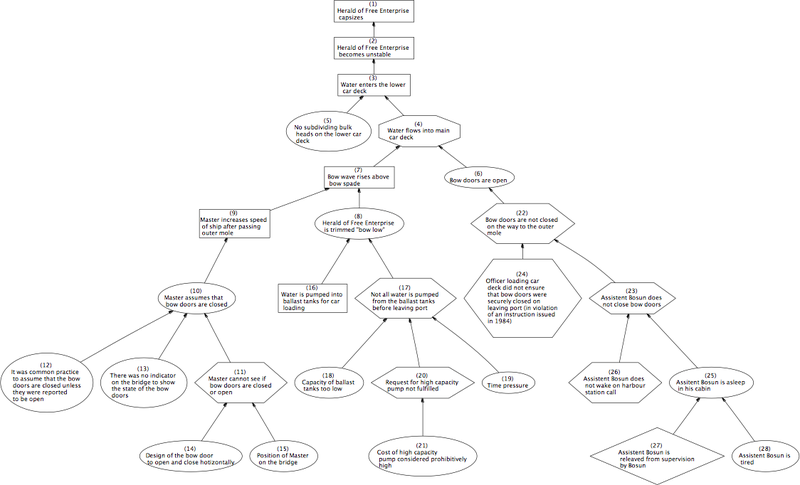
The image below shows a partial why-because graph used to analyze the capsizing of the Herald of Free Enterprise.
Junction patterns can be used to describe the graph structure of Bayesian networks.
Three possible patterns allowed in a 3-node directed acyclic graph (DAG) include: Various forms of causal relationships exist.
Imagine a garbage strike in a large city,
and vice versa, one can write an equation relating
It should be assumed that a relationship between two equations with identical senses of causality (such as
) is one of pure correlation unless both expressions are proven to be bi-directional causal equalities.