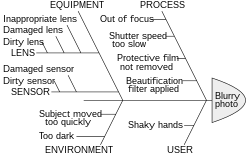
Ishikawa diagram
[2] Common uses of the Ishikawa diagram are product design and quality defect prevention to identify potential factors causing an overall effect.
[6] Root-cause analysis is intended to reveal key relationships among various variables, and the possible causes provide additional insight into process behavior.
At a practical level, a cause is whatever is responsible for, or explains, an effect - a factor "whose presence makes a critical difference to the occurrence of an outcome".
[8] The causes emerge by analysis, often through brainstorming sessions, and are grouped into categories on the main branches off the fishbone.
To help structure the approach, the categories are often selected from one of the common models shown below, but may emerge as something unique to the application in a specific case.