Charles Joseph Minard
Analysis of such graphs led Minard to conclude that passengers and freight traveling for short distances between intermediate stations (and not just end-to-end traffic) were of primary importance in designing rail lines.
[2]: 18 Minard created his "revolutionary"[2]: 40 first flow map in 1845 to inform the discussion about routing the rail line in the area between Dijon and Mulhouse.
[2]: 19 In subsequent decades Minard created tens of flow maps, illustrating subjects such as French wine exports and coal imports, British coal exports, freight traffic on French rivers and railways, European cotton imports, and international migration flows.
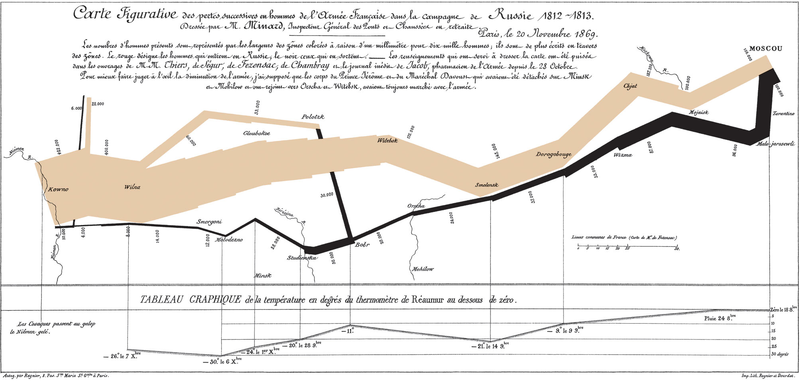
Minard is best known for his cartographic depiction of numerical data on a map of Napoleon's disastrous losses suffered during the Russian campaign of 1812 (in French, Carte figurative des pertes successives en hommes de l'Armée Française dans la campagne de Russie 1812–1813).
It displays six types of data in two dimensions: the number of Napoleon's troops; the distance traveled; temperature; latitude and longitude; direction of travel; and location relative to specific dates without making mention of Napoleon; Minard's interest lay with the travails and sacrifices of the soldiers.
In order to better judge with the eye the diminution of the army, I have assumed that the troops of Prince Jérôme and of Marshal Davout, who had been detached at Minsk and Mogilev and have rejoined near Orsha and Vitebsk, had always marched with the army.A modern redrawing of the map, translated into English: Minard's information graphics, many of which illustrated the flows of goods and people in transportation networks, were appreciated by public works officials during his lifetime.
Eugène Rouher, the secretary of agriculture, commerce, and public works in the government of Napoleon III, subscribed to Minard's prints, allowing him to publish ten thousand copies of maps on various subjects.
Rouher also presented Minard's maps to Napoleon III and included one of them in the background of his portrait, exhibited at the 1861 Paris Salon.
[4] French scientist, physiologist and chronophotographer Étienne-Jules Marey praised "its brutal eloquence, which seems to defy the pen of the historian".
[9] Howard Wainer identified Minard's map as a "gem" of information graphics, nominating it as the "World's Champion Graph".