Classical nucleation theory
[1][2][3][4] Nucleation is the first step in the spontaneous formation of a new thermodynamic phase or a new structure, starting from a state of metastability.
The time to nucleate can vary by orders of magnitude, from negligible to exceedingly large, far beyond reach of experimental timescales.
One of the key achievements of classical nucleation theory is to explain and quantify this immense variation.
in a supersaturated vapor would correspond to an average of 1000 droplets nucleating in a volume of 1 cubic meter in 1 second.
, is the number of nucleation sites multiplied by the probability that a nucleus of critical size has grown around it.
is the probability that a nucleus of critical size (at the maximum of the energy barrier) will continue to grow and not dissolve.
The Zeldovich factor is derived by assuming that the nuclei near the top of the barrier are effectively diffusing along the radial axis.
Sanz and coworkers[8] have used computer simulation to estimate all the quantities in the above equation, for the nucleation of ice in liquid water.
At a supercooling of 19.5 °C, i.e., 19.5 °C below the freezing point of water in their model, they estimate a free energy barrier to nucleation of ice of
, which means that on average one would have to wait 1083s (1076 years) to see a single ice nucleus forming in 1 m3 of water at -20 °C!
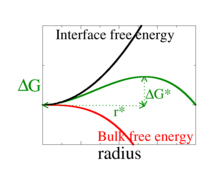
The classical theory[10] assumes that even for a microscopic nucleus of the new phase, we can write the free energy of a droplet
is the free energy per unit of volume of water minus that of supersaturated air at the same pressure.
The rate at which nucleation occurs is then limited by, i.e., determined by the probability, of forming the critical nucleus.
Similar equations can be set up for other dimensions and/or other shapes, using the appropriate expressions for the analogues of volume and surface area of the nucleus.
A state of metastable equilibrium is assumed, such that the methods of statistical mechanics hold at least approximately.
The inverse factorials are included to compensate for overcounting, since particles and clusters alike are assumed indistinguishable.
[17] The connection with the simple version of the theory is made by assuming perfectly spherical clusters, in which case
, thus including deviations from spherical shape as well as cluster degrees of freedom such as translation, vibration, and rotation.
[21][22] In fact, it has been shown that the effective surface tension of small droplets is smaller than that of the bulk liquid.
[23] In addition, the classical theory places restrictions on the kinetic pathways by which nucleation occurs, assuming clusters grow or shrink only by single particle adsorption/emission.
In reality, merging and fragmentation of entire clusters cannot be excluded as important kinetic pathways in some systems.
Particularly in dense systems or near the critical point – where clusters acquire an extended and ramified structure – such kinetic pathways are expected to contribute significantly.
[23] The behavior near the critical point also suggests the inadequacy, at least in some cases, of treating clusters as purely spherical.
: even small discrepancies in the microscopic parameters can lead to enormous changes in the predicted nucleation rate.
Instead, models must be fit directly to experimental data, which limits the ability to test their fundamental validity.
[25] For simple model systems, modern computers are powerful enough to calculate exact nucleation rates numerically.
The agreement of CNT with the simulated rates for this system confirms that the classical theory is a reasonable approximation.
[26] For simple models CNT works quite well; however it is unclear if it describes complex (e.g., molecular) systems equally well.
Nevertheless, certain variations on the classical theory have been claimed to represent the temperature dependence adequately, even if the absolute magnitude is inaccurate.
[28] Corrections to CNT, obtained from higher accuracy methods such as quantum chemical calculations, may improve the agreement with experiment.