Effect size
In statistics, an effect size is a value measuring the strength of the relationship between two variables in a population, or a sample-based estimate of that quantity.
Effect size is an essential component when evaluating the strength of a statistical claim, and it is the first item (magnitude) in the MAGIC criteria.
The standard deviation of the effect size is of critical importance, since it indicates how much uncertainty is included in the measurement.
[4][5] The reporting of effect sizes facilitates the interpretation of the importance of a research result, in contrast to its statistical significance.
Conventions for describing true and observed effect sizes follow standard statistical practices—one common approach is to use Greek letters like ρ [rho] to denote population parameters and Latin letters like r to denote the corresponding statistic.
An example of this is publication bias, which occurs when scientists report results only when the estimated effect sizes are large or are statistically significant.
[9] Sample-based effect sizes are distinguished from test statistics used in hypothesis testing, in that they estimate the strength (magnitude) of, for example, an apparent relationship, rather than assigning a significance level reflecting whether the magnitude of the relationship observed could be due to chance.
The interpretation of an effect size of being small, medium, or large depends on its substantive context and its operational definition.
However, Cohen also cautioned: "The terms 'small,' 'medium,' and 'large' are relative, not only to each other, but to the area of behavioral science or even more particularly to the specific content and research method being employed in any given investigation...
In the face of this relativity, there is a certain risk inherent in offering conventional operational definitions for these terms for use in power analysis in as diverse a field of inquiry as behavioral science.
This risk is nevertheless accepted in the belief that more is to be gained than lost by supplying a common conventional frame of reference which is recommended for use only when no better basis for estimating the ES index is available."
(p. 25)Sawilowsky[11] recommended that the rules of thumb for effect sizes should be revised, and expanded the descriptions to include very small, very large, and huge.
Funder and Ozer [12] suggested that effect sizes should be interpreted based on benchmarks and consequences of findings, resulting in adjustment of guideline recommendations.
Length [13] noted for a medium effect size, "you'll choose the same n regardless of the accuracy or reliability of your instrument, or the narrowness or diversity of your subjects.
Researchers should interpret the substantive significance of their results by grounding them in a meaningful context or by quantifying their contribution to knowledge, and Cohen's effect size descriptions can be helpful as a starting point.
"[6] Similarly, a U.S. Dept of Education sponsored report argued that the widespread indiscriminate use of Cohen's interpretation guidelines can be inappropriate and misleading.
[15][16][17] The table below contains descriptors for various magnitudes of d, r, f and omega, as initially suggested by Cohen,[10] and later expanded by Sawilowsky,[11] and by Funder & Ozer.
A related effect size is r2, the coefficient of determination (also referred to as R2 or "r-squared"), calculated as the square of the Pearson correlation r. In the case of paired data, this is a measure of the proportion of variance shared by the two variables, and varies from 0 to 1.
effect size measure for sequential multiple regression and also common for PLS modeling[21] is defined as:
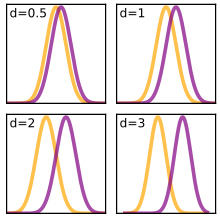
The raw effect size pertaining to a comparison of two groups is inherently calculated as the differences between the two means.
Other authors choose a slightly different computation of the standard deviation when referring to "Cohen's d" where the denominator is without "-2"[24][25]: 14
A lower Cohen's d indicates the necessity of larger sample sizes, and vice versa, as can subsequently be determined together with the additional parameters of desired significance level and statistical power.
Under a correct assumption of equal population variances a pooled estimate for σ is more precise.
[29] CRTs involve randomising clusters, such as schools or classrooms, to different conditions and are frequently used in education research.
This essentially presents the omnibus difference of the entire model adjusted by the root mean square, analogous to d or g. In addition, a generalization for multi-factorial designs has been provided.
) is defined as the ratio of mean to standard deviation of the difference of two random values respectively from two groups.
Phi is related to the point-biserial correlation coefficient and Cohen's d and estimates the extent of the relationship between two variables (2 × 2).
Phi can be computed by finding the square root of the chi-squared statistic divided by the sample size.
Similarly, Cramér's V is computed by taking the square root of the chi-squared statistic divided by the sample size and the length of the minimum dimension (k is the smaller of the number of rows r or columns c).
Had failure (a smaller probability) been used as the event (rather than passing), the difference between the two measures of effect size would not be so great.