Multiple comparisons problem
Several statistical techniques have been developed to address this problem, for example, by requiring a stricter significance threshold for individual comparisons, so as to compensate for the number of inferences being made.
Methods for family-wise error rate give the probability of false positives resulting from the multiple comparisons problem.
The problem of multiple comparisons received increased attention in the 1950s with the work of statisticians such as Tukey and Scheffé.
In 1996, the first international conference on multiple comparison procedures took place in Tel Aviv.
[3] This is an active research area with work being done by, for example Emmanuel Candès and Vladimir Vovk.
[4] Failure to compensate for multiple comparisons can have important real-world consequences, as illustrated by the following examples: In both examples, as the number of comparisons increases, it becomes more likely that the groups being compared will appear to differ in terms of at least one attribute.
Our confidence that a result will generalize to independent data should generally be weaker if it is observed as part of an analysis that involves multiple comparisons, rather than an analysis that involves only a single comparison.
However, if 100 tests are each conducted at the 5% level and all corresponding null hypotheses are true, the expected number of incorrect rejections (also known as false positives or Type I errors) is 5.
A single confidence interval with a 95% coverage probability level will contain the true value of the parameter in 95% of samples.
Summing each type of outcome over all Hi yields the following random variables: In m hypothesis tests of which
If m independent comparisons are performed, the family-wise error rate (FWER), is given by Hence, unless the tests are perfectly positively dependent (i.e., identical),
The most conservative method, which is free of dependence and distributional assumptions, is the Bonferroni correction
A marginally less conservative correction can be obtained by solving the equation for the family-wise error rate of
Another procedure is the Holm–Bonferroni method, which uniformly delivers more power than the simple Bonferroni correction, by testing only the lowest p-value (
Such non-replication can have many causes, but it is widely considered that failure to fully account for the consequences of making multiple comparisons is one of the causes.
[7] It has been argued that advances in measurement and information technology have made it far easier to generate large datasets for exploratory analysis, often leading to the testing of large numbers of hypotheses with no prior basis for expecting many of the hypotheses to be true.
In this situation, very high false positive rates are expected unless multiple comparisons adjustments are made.
For large-scale testing problems where the goal is to provide definitive results, the family-wise error rate remains the most accepted parameter for ascribing significance levels to statistical tests.
The FDR, loosely defined as the expected proportion of false positives among all significant tests, allows researchers to identify a set of "candidate positives" that can be more rigorously evaluated in a follow-up study.
[11] The practice of trying many unadjusted comparisons in the hope of finding a significant one is a known problem, whether applied unintentionally or deliberately, is sometimes called "p-hacking".
[12][13] A basic question faced at the outset of analyzing a large set of testing results is whether there is evidence that any of the alternative hypotheses are true.
One simple meta-test that can be applied when it is assumed that the tests are independent of each other is to use the Poisson distribution as a model for the number of significant results at a given level α that would be found when all null hypotheses are true.
A drawback of this approach is that it overstates the evidence that some of the alternative hypotheses are true when the test statistics are positively correlated, which commonly occurs in practice.
On the other hand, the approach remains valid even in the presence of correlation among the test statistics, as long as the Poisson distribution can be shown to provide a good approximation for the number of significant results.
This scenario arises, for instance, when mining significant frequent itemsets from transactional datasets.

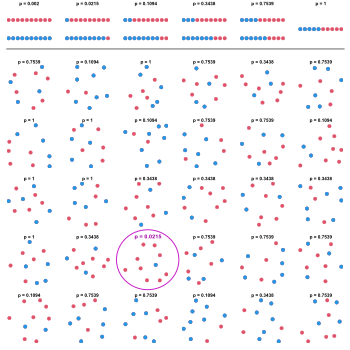
30 samples of 10 dots of random color (blue or red) are observed. On each sample, a two-tailed binomial test of the null hypothesis that blue and red are equally probable is performed. The first row shows the possible p-values as a function of the number of blue and red dots in the sample.
Although the 30 samples were all simulated under the null, one of the resulting p-values is small enough to produce a false rejection at the typical level 0.05 in the absence of correction.
