Comparison diagram
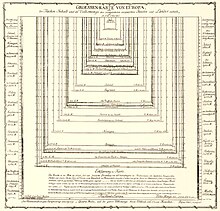
[5] Late 18th century August Friedrich Wilhelm Crome presented a diagram,[6][7] named "Groessen Karte von Europa" from 1785, where he compared the sizes of all then existing European countries.
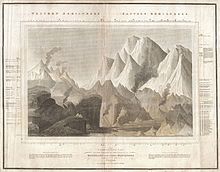
Early 19th century, Alexander von Humboldt was one of the first to picture various cross sections of mountains, including for example the "limit of perpetual snows at different latitudes," or the different kinds of vegetation on different heights.
[11] Much of this work was published in the 1914 "Atlas géographique et physique des régions équinoxiales du nouveau continent.
"[12] In 1805 Von Humboldt had published a map (see image), entitled "Ideen zu einer Geographie der Pflanzen nebst einem Naturgemälde der Tropenländer" (Ideas for a geography of plants, together with a nature paintings of the tropics) in which he made a comparison of the different types of plans in the tropics, and the heights on which they grew.
Early examples are: Another popular subject became the comparative views of the lengths of the principal rivers in one country or from all over the world.
In 1822 William Home Lizars presented a map, entitled "Comparative View of the Lengths of the Principal Rivers of Scotland.
by the political economist Henry Charles Carey and Isaac Lea published their 1822 "A Complete Historical, Chronological, and Geographical American Atlas.