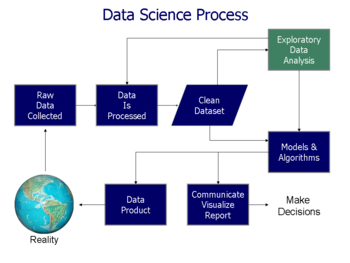
Data analysis
[6][7] Predictive analytics focuses on the application of statistical models for predictive forecasting or classification, while text analytics applies statistical, linguistic, and structural techniques to extract and classify information from textual sources, a species of unstructured data.
[1] Data is collected and analyzed to answer questions, test hypotheses, or disprove theories.
[14][15] The general type of entity upon which the data will be collected is referred to as an experimental unit (e.g., a person or population of people).
The requirements may be communicated by analysts to custodians of the data; such as, Information Technology personnel within an organization.
The data may also be collected from sensors in the environment, including traffic cameras, satellites, recording devices, etc.
For example; with financial information, the totals for particular variables may be compared against separately published numbers that are believed to be reliable.
[13] Mathematical formulas or models (also known as algorithms), may be applied to the data in order to identify relationships among the variables; for example, using correlation or causation.
[40] Analysts may also attempt to build models that are descriptive of the data, in an aim to simplify analysis and communicate results.
[49] Author Jonathan Koomey has recommended a series of best practices for understanding quantitative data.
[60] These include: For the variables under examination, analysts typically obtain descriptive statistics for them, such as the mean (average), median, and standard deviation.
[62] The consultants at McKinsey and Company named a technique for breaking a quantitative problem down into its component parts called the MECE principle.
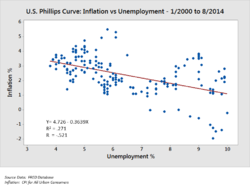
[68][69] For example, the hypothesis might be that "Unemployment has no effect on inflation", which relates to an economics concept called the Phillips Curve.
[73] Whereas (multiple) regression analysis uses additive logic where each X-variable can produce the outcome and the X's can compensate for each other (they are sufficient but not necessary),[76] necessary condition analysis (NCA) uses necessity logic, where one or more X-variables allow the outcome to exist, but may not produce it (they are necessary but not sufficient).
Distinguishing fact from opinion, cognitive biases, and innumeracy are all challenges to sound data analysis.
Effective analysis requires obtaining relevant facts to answer questions, support a conclusion or formal opinion, or test hypotheses.
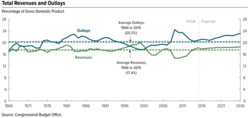
[85] For example, in August 2010, the Congressional Budget Office (CBO) estimated that extending the Bush tax cuts of 2001 and 2003 for the 2011–2020 time period would add approximately $3.3 trillion to the national debt.
[95] Persons communicating the data may also be attempting to mislead or misinform, deliberately using bad numerical techniques.
There are many such techniques employed by analysts, whether adjusting for inflation (i.e., comparing real vs. nominal data) or considering population increases, demographics, etc.
For example, when analysts perform financial statement analysis, they will often recast the financial statements under different assumptions to help arrive at an estimate of future cash flow, which they then discount to present value based on some interest rate, to determine the valuation of the company or its stock.
[100][101] Similarly, the CBO analyzes the effects of various policy options on the government's revenue, outlays and deficits, creating alternative future scenarios for key measures.
[104] Analytics is the "extensive use of data, statistical and quantitative analysis, explanatory and predictive models, and fact-based management to drive decisions and actions."
[107] This section contains rather technical explanations that may assist practitioners but are beyond the typical scope of a Wikipedia article.
Data quality can be assessed in several ways, using different types of analysis: frequency counts, descriptive statistics (mean, standard deviation, median), normality (skewness, kurtosis, frequency histograms), normal imputation is needed.
[114] The quality of the measurement instruments should only be checked during the initial data analysis phase when this is not the focus or research question of the study.
[122]Other possible data distortions that should be checked are: In any report or article, the structure of the sample must be accurately described.
Nonlinear systems can exhibit complex dynamic effects including bifurcations, chaos, harmonics and subharmonics that cannot be analyzed using simple linear methods.
When testing multiple models at once there is a high chance on finding at least one of them to be significant, but this can be due to a type 1 error.
[138] It is important to always adjust the significance level when testing multiple models with, for example, a Bonferroni correction.
Often, the correct order of running scripts is only described informally or resides in the data scientist's memory.
Additionally, dynamic documentation is crucial, providing reports that are understandable by both machines and humans, ensuring accurate representation of the analysis workflow even as scripts evolve.