Isotopic labeling
Because the labeled atom has the same number of protons, it will behave in almost exactly the same way as its unlabeled counterpart and, with few exceptions, will not interfere with the reaction under investigation.
Nuclear magnetic resonance (NMR) and mass spectrometry (MS) are used to investigate the mechanisms of chemical reactions.
NMR and MS detects isotopic differences, which allows information about the position of the labeled atoms in the products' structure to be determined.
Isotopic tracers are some of the most important tools in geology because they can be used to understand complex mixing processes in earth systems.
The chosen isotope can act as a label on that compound that can be identified through nuclear magnetic resonance (NMR) and mass spectrometry (MS).
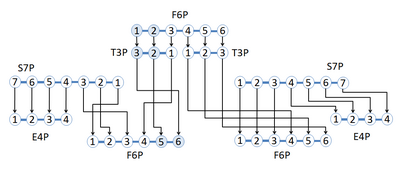
The output isotope pattern provides valuable information, which can be used to find the magnitude of flux, rate of conversion from reactants to products, through each reaction.
[10] MFA combines the data harvested from isotope labeling with the stoichiometry of each reaction, constraints, and an optimization procedure resolve a flux map.
The limit to proton NMR is that if there are n carbon atoms in a metabolite, there can only be at most n different positional enrichment values, which is only a small fraction of the total isotopomer information.
As opposed to nuclear magnetic resonance, mass spectrometry (MS) is another method that is more applicable and sensitive to metabolic flux analysis experiments.
Different from two-dimensional nuclear magnetic resonance (2D-NMR), the MS instruments work directly with hydrolysate.
[12] The drawback to using MS techniques is that for gas chromatography, the sample must be prepared by chemical derivatization in order to obtain molecules with charge.
N,N-Dimethylformamide dimethyl acetal (DMFDMA)[14] and N-(tert-butyldimethylsilyl)-N-methyltrifluoroacetamide (MTBSTFA) [15] are two examples of compounds that have been used to derivatize amino acids.
In addition, strong isotope effects observed affect the retention time of differently labeled isotopomers in the GC column.
[15] Lastly, the natural abundance of other atoms than carbon also leads to a disturbance in the mass isotopomer spectrum.
When a positron collides with an electron, it releases two high-energy photons traveling in diametrically opposite directions.
Strictly speaking, radioisotopic labeling includes only cases where radioactivity is artificially introduced by experimenters, but some natural phenomena allow similar analysis to be performed.
[16] While radioisotopes had been used in human nutrition research for several decades prior, stable isotopes presented a safer option, especially in subjects for which there is elevated concern about radiation exposure, e.g. pregnant and lactating women and children.
The use of stable isotopes instead of radioisotopes does have several drawbacks: larger quantities of tracer are required, having the potential of perturbing the naturally existing mineral; analytical sample preparation is more complex and mass spectrometry instrumentation more costly; the presence of tracer in whole bodies or particular tissues cannot be measured externally.
Most of the minerals that are essential for human health and of particular interest to nutrition researchers have stable isotopes, some well-suited as biological tracers because of their low natural abundance.
Aspects of mineral nutrition/metabolism that are studied include absorption (from the gastrointestinal tract into the body), distribution, storage, excretion and the kinetics of these processes.
The measurement of mineral absorption from the diet, often conceived of as bioavailability, is the most common application of isotope tracer methods to nutrition research.
Among the purposes of such studies are the investigations of how absorption is influenced by type of food (e.g. plant vs animal source, breast milk vs formula), other components of the diet (e.g. phytate), disease and metabolic disorders (e.g. environmental enteric dysfunction), the reproductive cycle, quantity of mineral in diet, chronic mineral deficiency, subject age and homeostatic mechanisms.
[25][26] When tracer is administered with food for the purpose of observing mineral absorption and metabolism, it may be in the form of an intrinsic or extrinsic label.
[29] Due to the prevalence of mineral deficiencies and their critical impact on human health and well-being in resource-poor countries, the International Atomic Energy Agency has recently published detailed and comprehensive descriptions of stable isotope methods to facilitate the dissemination of this knowledge to researchers beyond western academic centers.
[23][30] In proteomics, the study of the full set of proteins expressed by a genome, identifying diseases biomarkers can involve the usage of stable isotope labeling by amino acids in cell culture (SILAC), that provides isotopic labeled forms of amino acid used to estimate protein levels.
The researchers measure the isotopic ratios at different locations and times to infer information about the physical processes of the ocean.
For example, low isotopic ratios in surface water with very high values a few meters down would indicate a vertical flux in the downward direction.
The isotopic ratio of radium will then decrease as the water from the source river enters a bay or estuary.
For example, in rubidium–strontium dating, the isotopic ratio of strontium (87Sr/86Sr) can be analyzed within ice cores to examine changes over the earth's lifetime.
For example, differences in lateral isotopic ratios within an ocean can indicate strong water fronts or gyres.