Mathematical modelling of infectious diseases
The modelling can help decide which intervention(s) to avoid and which to trial, or can predict future growth patterns, etc.
[1] The first scientist who systematically tried to quantify causes of death was John Graunt in his book Natural and Political Observations made upon the Bills of Mortality, in 1662.
The earliest account of mathematical modelling of spread of disease was carried out in 1760 by Daniel Bernoulli.
Trained as a physician, Bernoulli created a mathematical model to defend the practice of inoculating against smallpox.
[4] In the early 20th century, William Hamer[5] and Ronald Ross[6] applied the law of mass action to explain epidemic behaviour.
[9] Epidemiological ABMs, in spite of their complexity and requiring high computational power, have been criticized for simplifying and unrealistic assumptions.
A stochastic model is a tool for estimating probability distributions of potential outcomes by allowing for random variation in one or more inputs over time.
Stochastic models depend on the chance variations in risk of exposure, disease and other illness dynamics.
Statistical agent-level disease dissemination in small or large populations can be determined by stochastic methods.
[14][15][16] When dealing with large populations, as in the case of tuberculosis, deterministic or compartmental mathematical models are often used.
In a deterministic model, individuals in the population are assigned to different subgroups or compartments, each representing a specific stage of the epidemic.
[17] The transition rates from one class to another are mathematically expressed as derivatives, hence the model is formulated using differential equations.
While building such models, it must be assumed that the population size in a compartment is differentiable with respect to time and that the epidemic process is deterministic.
[7] Formally, these models belong to the class of deterministic models; however, they incorporate heterogeneous social features into the dynamics, such as individuals' levels of sociality, opinion, wealth, geographic location, which profoundly influence disease propagation.
Following the derivation principles of kinetic theory, they provide a more rigorous description of epidemic dynamics by starting from agent-based interactions.
[21] For example, if a contact network can be approximated with an Erdős–Rényi graph with a Poissonian degree distribution, and the disease spreading parameters are as defined in the example above, such that
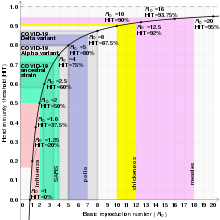
Notice that this relation means that for a disease to be in the endemic steady state, the higher the basic reproduction number, the lower the proportion of the population susceptible must be, and vice versa.
Let the average age of infection be A, for instance when individuals younger than A are susceptible and those older than A are immune (or infectious).
Then it can be shown by an easy argument that the proportion of the population that is susceptible is given by: We reiterate that L is the age at which in this model every individual is assumed to die.
But the mathematical definition of the endemic steady state can be rearranged to give: Therefore, due to the transitive property: This provides a simple way to estimate the parameter R0 using easily available data.
In 1927, W. O. Kermack and A. G. McKendrick created a model in which they considered a fixed population with only three compartments: susceptible,
Many theoretical studies of the population dynamics, structure and evolution of infectious diseases of plants and animals, including humans, are concerned with this problem.
Die out of transmission will only occur if the proportion of immune individuals exceeds this level due to a mass vaccination programme.
, we obtain: If the vaccine used is insufficiently effective or the required coverage cannot be reached, the program may fail to exceed qc.
As a consequence of this lower basic reproduction number, the average age of infection A will also change to some new value Aq in those who have been left unvaccinated.
Recall the relation that linked R0, A and L. Assuming that life expectancy has not changed, now:[citation needed] But R0 = L/A so: Thus, the vaccination program may raise the average age of infection, and unvaccinated individuals will experience a reduced force of infection due to the presence of the vaccinated group.
[citation needed] Models have the advantage of examining multiple outcomes simultaneously, rather than making a single forecast.
Models have shown broad degrees of reliability in past pandemics, such as SARS, SARS-CoV-2,[30] Swine flu, MERS and Ebola.