Fourier-transform infrared spectroscopy
This confers a significant advantage over a dispersive spectrometer, which measures intensity over a narrow range of wavelengths at a time.
Measurements in the far infrared needed the development of accurately ruled diffraction gratings to replace the prisms as dispersing elements, since salt crystals are opaque in this region.
The advantages of the Michelson interferometer were well-known, but considerable technical difficulties had to be overcome before a commercial instrument could be built.
Also an electronic computer was needed to perform the required Fourier transform, and this only became practicable with the advent of minicomputers, such as the PDP-8, which became available in 1965.
[4][5] In a Michelson interferometer adapted for FTIR, light from the polychromatic infrared source, approximately a black-body radiator, is collimated and directed to a beam splitter.
The form of the interferogram when no sample is present depends on factors such as the variation of source intensity and splitter efficiency with wavelength.
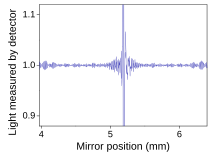
The position of zero retardation is determined accurately by finding the point of maximum intensity in the interferogram.
Some systems incorporate a compensating mechanism that automatically adjusts the orientation of one mirror to maintain the alignment.
Arrangements that avoid this problem include using cube corner reflectors instead of plane mirrors as these have the property of returning any incident beam in a parallel direction regardless of orientation.
The interferogram has to be measured from zero path difference to a maximum length that depends on the resolution required.
Mechanical design limitations may mean that for the highest resolution the scan runs to the maximum OPD on one side of zero only.
This requires it to be stored in digital form as a series of values at equal intervals of the path difference between the two beams.
If the OPD is not large enough to allow the interferogram signal to decay to a negligible level there will be unwanted oscillations or sidelobes associated with the features in the resulting spectrum.
The throughput advantage is important for high-resolution FTIR, as the monochromator in a dispersive instrument with the same resolution would have very narrow entrance and exit slits.
In 1966 Janine Connes measured the temperature of the atmosphere of Venus by recording the vibration-rotation spectrum of Venusian CO2 at 0.1 cm−1 resolution.
For the mid-IR region, 2−25 μm (5,000–400 cm−1), the most common source is a silicon carbide (SiC) element heated to about 1,200 K (930 °C; 1,700 °F) (Globar).
Shorter wavelengths of the near-IR, 1−2.5 μm (10,000–4,000 cm−1), require a higher temperature source, typically a tungsten-halogen lamp.
For the far-IR, especially at wavelengths beyond 50 μm (200 cm−1) a mercury discharge lamp gives higher output than a thermal source.
[8] Far-IR spectrometers commonly use pyroelectric detectors that respond to changes in temperature as the intensity of IR radiation falling on them varies.
For the mid-IR region, the beamsplitter is usually made of KBr with a germanium-based coating that makes it semi-reflective.
The reason for this has to do with the mechanical tolerance needed for good optical performance, which is related to the wavelength of the light being used.
With the advent of cheap microcomputers it became possible to have a computer dedicated to controlling the spectrometer, collecting the data, doing the Fourier transform and presenting the spectrum.
Fourier transform infrared spectroscopy is used in geology,[11] chemistry, materials, botany[12] and biology research fields.
Studies show the ability of FTIR to directly determine the polarity at a given site along the backbone of a transmembrane protein.
[14][15] The bond features involved with various organic and inorganic nanomaterials and their quantitative analysis can be done with the help of FTIR.
[18] The spatial resolution of FTIR can be further improved below the micrometer scale by integrating it into scanning near-field optical microscopy platform.
The corresponding technique is called nano-FTIR and allows for performing broadband spectroscopy on materials in ultra-small quantities (single viruses and protein complexes) and with 10 to 20 nm spatial resolution.
One notable exception is to measure chain branching as a function of molecular size in polyethylene using gel permeation chromatography, which is possible using chlorinated solvents that have no absorption in the area in question.
FTIR analysis is used to determine water content in fairly thin plastic and composite parts, more commonly in the laboratory setting.
[20] FTIR method uses the maxima of the absorbance band at about 5,200 cm−1 which correlates with the true water content in the material.