Genome-wide association study
GWA studies typically focus on associations between single-nucleotide polymorphisms (SNPs) and traits like major human diseases, but can equally be applied to any other genetic variants and any other organisms.
When applied to human data, GWA studies compare the DNA of participants having varying phenotypes for a particular trait or disease.
GWA studies investigate the entire genome, in contrast to methods that specifically test a small number of pre-specified genetic regions.
GWA studies identify SNPs and other variants in DNA associated with a disease, but they cannot on their own specify which genes are causal.
[5] As of 2017[update], over 3,000 human GWA studies have examined over 1,800 diseases and traits, and thousands of SNP associations have been found.
Any of these may cause alterations in an individual's traits, or phenotype, which can be anything from disease risk to physical properties such as height.
[9][8][10] However, for common and complex diseases the results of genetic linkage studies proved hard to reproduce.
Early calculations on statistical power indicated that this approach could be better than linkage studies at detecting weak genetic effects.
One was the advent of biobanks, which are repositories of human genetic material that greatly reduced the cost and difficulty of collecting sufficient numbers of biological specimens for study.
[12] Another was the International HapMap Project, which, from 2003 identified a majority of the common SNPs interrogated in a GWA study.
[13] The haploblock structure identified by HapMap project also allowed the focus on the subset of SNPs that would describe most of the variation.
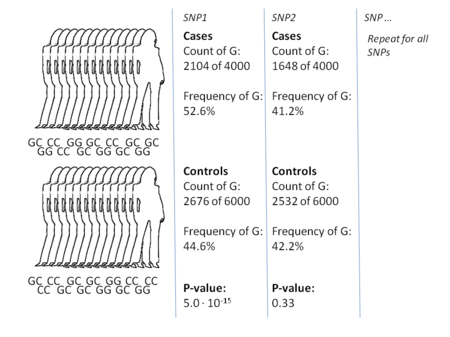
Finding odds ratios that are significantly different from 1 is the objective of the GWA study because this shows that a SNP is associated with disease.
A common alternative to case-control GWA studies is the analysis of quantitative phenotypic data, e.g. height or biomarker concentrations or even gene expression.
[27] Because of this association, studies must take account of the geographic and ethnic background of participants by controlling for what is called population stratification.
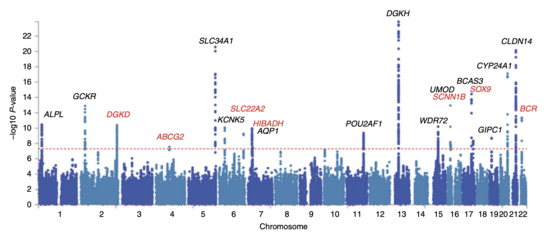
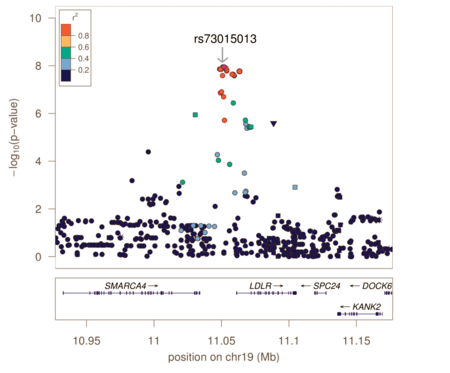
In the context of GWA studies, this plot shows the negative logarithm of the P-value as a function of genomic location.
[34] The first GWA study, conducted in 2005, compared 96 patients with age-related macular degeneration (ARMD) with 50 healthy controls.
The findings from these first GWA studies have subsequently prompted further functional research towards therapeutical manipulation of the complement system in ARMD.
[41] The reason is the drive towards reliably detecting risk-SNPs that have smaller effect sizes and lower allele frequency.
[47] A challenge for future successful GWA study is to apply the findings in a way that accelerates drug and diagnostics development, including better integration of genetic studies into the drug-development process and a focus on the role of genetic variation in maintaining health as a blueprint for designing new drugs and diagnostics.
[51] One such success is related to identifying the genetic variant associated with response to anti-hepatitis C virus treatment.
[53] These major findings facilitated the development of personalized medicine and allowed physicians to customize medical decisions based on the patient's genotype.
[55] The reason is that GWAS studies identify risk-SNPs, but not risk-genes, and specification of genes is one step closer towards actionable drug targets.
[42] Functional follow up studies of this locus using small interfering RNA and gene knock-out mice have shed light on the metabolism of low-density lipoproteins, which have important clinical implications for cardiovascular disease.
GWA studies is a powerful tool to detect the relationships of certain variants and the resistance to the plant pathogen, which is beneficial for developing new pathogen-resisted cultivars.
A high-profile GWA study that investigated individuals with very long life spans to identify SNPs associated with longevity is an example of this.
[72] The publication came under scrutiny because of a discrepancy between the type of genotyping array in the case and control group, which caused several SNPs to be falsely highlighted as associated with longevity.
If there are substantial differences between groups on the type of genotyping array, as with any confounder, GWA studies could result in a false positive.
Another consequence is that such studies are unable to detect the contribution of very rare mutations not included in the array or able to be imputed.
[76] Additionally, GWA studies identify candidate risk variants for the population from which their analysis is performed, and with most GWA studies historically stemming from European databases, there is a lack of translation of the identified risk variants to other non-European populations.
[78][79] More recently, the rapidly decreasing price of complete genome sequencing have also provided a realistic alternative to genotyping array-based GWA studies.