Human genetic variation
In medicine, study of human genetic variation may be important because some disease-causing alleles occur more often in certain population groups.
For instance, the mutation for sickle-cell anemia is more often found in people with ancestry from certain sub-Saharan African, south European, Arabian, and Indian populations, due to the evolutionary pressure from mosquitos carrying malaria in these regions.
[16][17] Causes of differences between individuals include independent assortment, the exchange of genes (crossing over and recombination) during reproduction (through meiosis) and various mutational events.
A functional, or non-synonymous, SNP is one that affects some factor such as gene splicing or messenger RNA, and so causes a phenotypic difference between members of the species.
Neutral, or synonymous SNPs are still useful as genetic markers in genome-wide association studies, because of their sheer number and the stable inheritance over generations.
[2] A copy-number variation (CNV) is a difference in the genome due to deleting or duplicating large regions of DNA on some chromosome.
In biology, a cline is a continuum of species, populations, varieties, or forms of organisms that exhibit gradual phenotypic and/or genetic differences over a geographical area, typically as a result of environmental heterogeneity.
[43][44][45] In the scientific study of human genetic variation, a gene cline can be rigorously defined and subjected to quantitative metrics.
In the study of molecular evolution, a haplogroup is a group of similar haplotypes that share a common ancestor with a single nucleotide polymorphism (SNP) mutation.
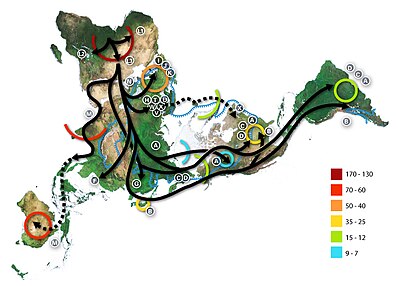
The "out of Africa" theory originates in the 19th century, as a tentative suggestion in Charles Darwin's Descent of Man,[47] but remained speculative until the 1980s when it was supported by the study of present-day mitochondrial DNA, combined with evidence from physical anthropology of archaic specimens.
[55] It is commonly assumed that early humans left Africa, and thus must have passed through a population bottleneck before their African-Eurasian divergence around 100,000 years ago (ca.
Sub-Saharan Africa has the most human genetic diversity and the same has been shown to hold true for phenotypic variation in skull form.
[61] Understanding how genetic diversity in the human population impacts various levels of gene expression is an active area of research.
Another study published in 2007 found that approximately 83% of genes were expressed at different levels among individuals and about 17% between populations of European and African descent.
[72] Graves (1996) has countered that FST should not be used as a marker of subspecies status, as the statistic is used to measure the degree of differentiation between populations,[72] although see also Wright (1978).
They argue the underlying statistical model incorrectly assumes equal and independent histories of variation for each large human population.
[77][78] Between 4% and 6% of the genome of Melanesians (represented by the Papua New Guinean and Bougainville Islander) appears to derive from Denisovans – a previously unknown hominin which is more closely related to Neanderthals than to Sapiens.
[80] Hammer et al. tested the hypothesis that contemporary African genomes have signatures of gene flow with archaic human ancestors and found evidence of archaic admixture in the genomes of some African groups, suggesting that modest amounts of gene flow were widespread throughout time and space during the evolution of anatomically modern humans.
Other observers disagree, saying that the same data undercut traditional notions of racial groups (King and Motulsky 2002; Calafell 2003; Tishkoff and Kidd 2004[24]).
In many parts of the world, groups have mixed in such a way that many individuals have relatively recent ancestors from widely separated regions.
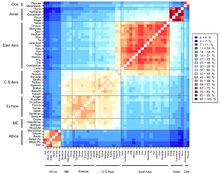
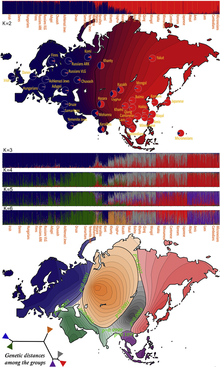
Genetic data can be used to infer population structure and assign individuals to groups that often correspond with their self-identified geographical ancestry.
Jorde and Wooding (2004) argued that "Analysis of many loci now yields reasonably accurate estimates of genetic similarity among individuals, rather than populations.
"[23] However, identification by geographic origin may quickly break down when considering historical ancestry shared between individuals back in time.
[87] An analysis of autosomal SNP data from the International HapMap Project (Phase II) and CEPH Human Genome Diversity Panel samples was published in 2009.
The study of 53 populations taken from the HapMap and CEPH data (1138 unrelated individuals) suggested that natural selection may shape the human genome much more slowly than previously thought, with factors such as migration within and among continents more heavily influencing the distribution of genetic variations.
[89] In a 2016 study, principal component analysis of genome-wide data was capable of recovering previously-known targets for positive selection (without prior definition of populations) as well as a number of new candidate genes.
[94] An analysis of phenotypic and genetic variation including skin color and socio-economic status was carried out in the population of Cape Verde which has a well documented history of contact between Europeans and Africans.
The studies showed that pattern of admixture in this population has been sex-biased (involving mostly matings between European men and African women) and there is a significant interaction between socioeconomic status and skin color, independent of ancestry.
[95] Another study shows an increased risk of graft-versus-host disease complications after transplantation due to genetic variants in human leukocyte antigen (HLA) and non-HLA proteins.
For example, genes that allow humans to more efficiently process food also make people susceptible to obesity and diabetes today.