Geographic information system
[1] In a broader sense, one may consider such a system also to include human users and support staff, procedures and workflows, the body of knowledge of relevant concepts and methods, and institutional organizations.
[6] French cartographer and geographer Charles Picquet created a map outlining the forty-eight districts in Paris, using halftone color gradients, to provide a visual representation for the number of reported deaths due to cholera per every 1,000 inhabitants.
While the basic elements of topography and theme existed previously in cartography, Snow's map was unique due to his use of cartographic methods, not only to depict, but also to analyze clusters of geographically dependent phenomena.
It supported a national coordinate system that spanned the continent, coded lines as arcs having a true embedded topology and it stored the attribute and locational information in separate files.
More recently, a growing number of free, open-source GIS packages run on a range of operating systems and can be customized to perform specific tasks.
[19] These and other desktop GIS applications include a full suite of capabilities for entering, managing, analyzing, and visualizing geographic data, and are designed to be used on their own.
These GIS coordinates may represent other quantified systems of temporo-spatial reference (for example, film frame number, stream gage station, highway mile-marker, surveyor benchmark, building address, street intersection, entrance gate, water depth sounding, POS or CAD drawing origin/units).
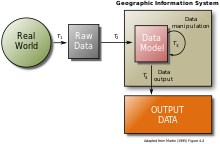
Related by accurate spatial information, an incredible variety of real-world and projected past or future data can be analyzed, interpreted and represented.
[23] This key characteristic of GIS has begun to open new avenues of scientific inquiry into behaviors and patterns of real-world information that previously had not been systematically correlated.
The most common types of phenomena that are represented in data can be divided into two conceptualizations: discrete objects (e.g., a house, a road) and continuous fields (e.g., rainfall amount or population density).
With the wide availability of ortho-rectified imagery (from satellites, aircraft, Helikites and UAVs), heads-up digitizing is becoming the main avenue through which geographic data is extracted.
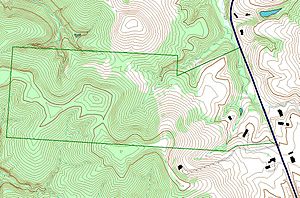
Thus, terrain data is often a core dataset in a GIS, usually in the form of a raster Digital elevation model (DEM) or a Triangulated irregular network (TIN).
Slope, aspect, and surface curvature in terrain analysis are all derived from neighborhood operations using elevation values of a cell's adjacent neighbours.
This is due to the limitations of the applied statistic and data collection methods, and interpolation is required to predict the behavior of particles, points, and locations that are not directly measurable.
Finally, there is whether a method is global (it uses the entire data set to form the model), or local where an algorithm is repeated for a small section of terrain.
Interpolation is a justified measurement because of a spatial autocorrelation principle that recognizes that data collected at any position will have a great similarity to, or influence of those locations within its immediate vicinity.
Coupled with GIS, multi-criteria decision analysis methods support decision-makers in analysing a set of alternative spatial solutions, such as the most likely ecological habitat for restoration, against multiple criteria, such as vegetation cover or roads.
Data mining, which is the partially automated search for hidden patterns in large databases, offers great potential benefits for applied GIS-based decision making.
Cartographic work serves two major functions: First, it produces graphics on the screen or on paper that convey the results of analysis to the people who make decisions about resources.
Traditional maps are abstractions of the real world, a sampling of important elements portrayed on a sheet of paper with symbols to represent physical objects.
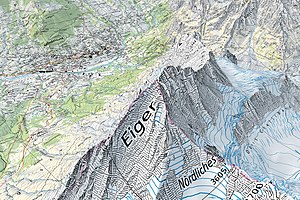
Today, graphic display techniques such as shading based on altitude in a GIS can make relationships among map elements visible, heightening one's ability to extract and analyze information.
These services give the public access to huge amounts of geographic data, perceived by many users to be as trustworthy and usable as professional information.
[50][51] Since its origin in the 1960s, GIS has been used in an ever-increasing range of applications, corroborating the widespread importance of location and aided by the continuing reduction in the barriers to adopting geospatial technology.
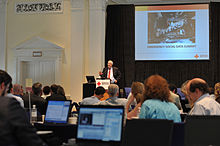
Geospatial data can be used by federal authorities like FEMA to create maps that show the extent of a disaster, the location of people in need, and the location of debris, create models that estimate the number of people at risk and the amount of damage, improve communication between emergency responders, land managers, and scientists, as well as help determine where to allocate resources, such as emergency medical resources or search and rescue teams and plan evacuation routes and identify which areas are most at risk.
The RGO's mission is to support decision makers in understanding the size, scope, and extent of disaster impacts so they can deliver resources to the communities most in need.
GIS technology gives researchers the ability to examine the variations in Earth processes over days, months, and years through the use of cartographic visualizations.
In addition to the integration of time in environmental studies, GIS is also being explored for its ability to track and model the progress of humans throughout their daily routines.
GeoSPARQL is a standard developed by the Ordnance Survey, United States Geological Survey, Natural Resources Canada, Australia's Commonwealth Scientific and Industrial Research Organisation and others to support ontology creation and reasoning using well-understood OGC literals (GML, WKT), topological relationships (Simple Features, RCC8, DE-9IM), RDF and the SPARQL database query protocols.
[91][92] It has been argued that the production, distribution, utilization, and representation of geographic information are largely related with the social context and has the potential to increase citizen trust in government.
[97]: 36 GIS seems to provide many advantages in teaching geography because it allows for analysis based on real geographic data and also helps raise research questions from teachers and students in the classroom.