Global surface temperature
[7] The global average and combined land and ocean surface temperature show a warming of 1.09 °C (range: 0.95 to 1.20 °C) from 1850–1900 to 2011–2020, based on multiple independently produced datasets.
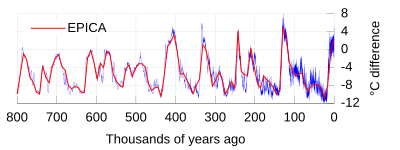
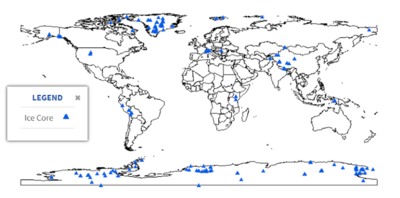
Tree rings and measurements from ice cores can give evidence about the global temperature from 1,000-2,000 years before the present until now.
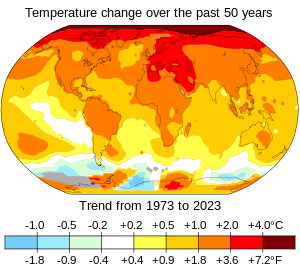
[11]: 12 Changes in global temperatures over the past century provide evidence for the effects of increasing greenhouse gases.
The global average and combined land and ocean surface temperature, show a warming of 1.09 °C (range: 0.95 to 1.20 °C) from 1850–1900 to 2011–2020, based on multiple independently produced datasets.
[8]: 5 For 1980 to 2020, the linear warming trend for combined land and sea temperatures has been 0.18 °C to 0.20 °C per decade, depending on the data set used.
Instrumental temperature records do not use indirect reconstructions using climate proxy data such as from tree rings and marine sediments.
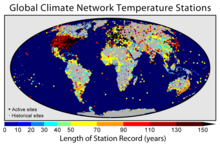
[31] The period for which reasonably reliable instrumental records of near-surface land temperature exist with quasi-global coverage is generally considered to begin around 1850.
Weather balloon radiosonde measurements of atmospheric temperature at various altitudes begin to show an approximation of global coverage in the 1950s.
Both the University of Alabama in Huntsville (UAH) and the private, NASA funded, corporation Remote Sensing Systems (RSS) find an upward trend.
The methods used to derive the principal estimates of global surface temperature trends are largely independent from each other and include: These datasets are updated frequently, and are generally in close agreement with each other.
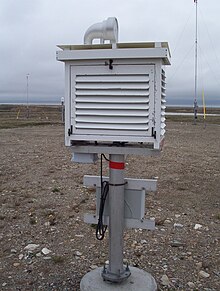
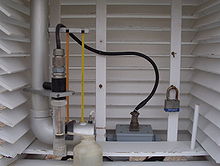
[45] The U.S. National Weather Service Cooperative Observer Program has established minimum standards regarding the instrumentation, siting, and reporting of surface temperature stations.
[46] The observing systems available are able to detect year-to-year temperature variations such as those caused by El Niño or volcanic eruptions.
[47] Another study concluded in 2006, that existing empirical techniques for validating the local and regional consistency of temperature data are adequate to identify and remove biases from station records, and that such corrections allow information about long-term trends to be preserved.
[61] Factors that influence global temperature include: There is a scientific consensus that climate is changing and that greenhouse gases emitted by human activities are the primary driver.
[63] The scientific consensus is reflected, for example, by the Intergovernmental Panel on Climate Change (IPCC), an international body which summarizes existing science, and the U.S.
[63] The U.S. National Academy of Sciences, both in its 2002 report to President George W. Bush, and in later publications, has strongly endorsed evidence of an average global temperature increase in the 20th century.
The preliminary results of an assessment carried out by the Berkeley Earth Surface Temperature group and made public in October 2011, found that over the past 50 years the land surface warmed by 0.911 °C, and their results mirrors those obtained from earlier studies carried out by the NOAA, the Hadley Centre and NASA's GISS.
[72][73] The El Niño in 1998 was particularly strong, possibly one of the strongest of the 20th century, and 1998 was at the time the world's warmest year on record by a substantial margin.
[citation needed] A decadal forecast by the World Meteorological Organisation issued in 2021 stated a probability of 40% of having a year above 1.5 C in the 2021-2025 period.
[citation needed] Global warming is very likely to reach 1.0 °C to 1.8 °C by the late 21st century under the very low GHG emissions scenario.
Tree rings and measurements from ice cores can give evidence about the global temperature from 1,000-2,000 years ago.
Data sets from multiple complementary proxies covering overlapping time periods and areas are reconciled to produce the final reconstructions.
These reconstructions indicate:[83] As well as natural, numerical proxies (tree-ring widths, for example) there exist records from the human historical period that can be used to infer climate variations, including: reports of frost fairs on the Thames; records of good and bad harvests; dates of spring blossom or lambing; extraordinary falls of rain and snow; and unusual floods or droughts.
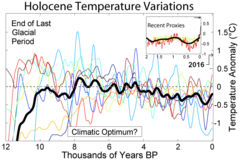
The 10,000 years of the Holocene epoch covers most of this period, since the end of the Northern Hemisphere's Younger Dryas millennium-long cooling.
The Holocene Climatic Optimum was generally warmer than the 20th century, but numerous regional variations have been noted since the start of the Younger Dryas.
[90] When scientists explored the trapped gas in the ice core bubbles, they found that the methane concentration in Greenland ice core is significantly higher than that in Antarctic samples of similar age, the records of changes of concentration difference between Greenland and Antarctic reveal variation of latitudinal distribution of methane sources.
[92] Increase in methane concentration shown by Greenland ice core records implies that the global wetland area has changed greatly over past years.
[97] According to these records, scientists found the evidence which can prove the Last Glacial Maximum (LGM) was colder in the tropics and subtropics than previously believed.
[97] On longer time scales, sediment cores show that the cycles of glacials and interglacials are part of a deepening phase within a prolonged ice age that began with the glaciation of Antarctica approximately 40 million years ago.
This deepening phase, and the accompanying cycles, largely began approximately 3 million years ago with the growth of continental ice sheets in the Northern Hemisphere.


