Little Ice Age
The Intergovernmental Panel on Climate Change Third Assessment Report (TAR) of 2001 described the areas that were affected: Evidence from mountain glaciers does suggest increased glaciation in a number of widely spread regions outside Europe prior to the twentieth century, including Alaska, New Zealand and Patagonia.
[3]The IPCC Fourth Assessment Report (AR4) of 2007 discusses more recent research and gives particular attention to the Medieval Warm Period: ... when viewed together, the currently available reconstructions indicate generally greater variability in centennial time scale trends over the last 1 kyr than was apparent in the TAR. ...
[27] As trade needed to continue during the prolonged winter often spanning 5 months, merchants equipped their boer style boats with planks and skates (runners), hence the iceboat was born.
The winter of 1794–1795 was particularly harsh: the French invasion army under Pichegru marched on the frozen rivers of the Netherlands, and the Dutch fleet was locked in the ice in Den Helder harbour.
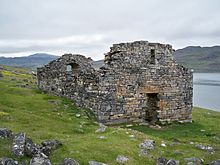
The last document from the settlements dates from 1412, and over the following decades, the remaining Europeans left in what seems to have been a gradual withdrawal, which was caused mainly by economic factors such as increased availability of farms in Scandinavian countries.
[40] According to the science historian James Burke, the period inspired such novelties in everyday life as the widespread use of buttons and button-holes, as well as knitting of custom-made undergarments for the better covering and insulating of the body.
[41] The Little Ice Age, by the anthropologist Brian Fagan of the University of California at Santa Barbara, describes the plight of European peasants from 1300 to 1850: famines, hypothermia, bread riots and the rise of despotic leaders brutalizing an increasingly dispirited peasantry.
In the late 17th century, agriculture had dropped off dramatically: "Alpine villagers lived on bread made from ground nutshells mixed with barley and oat flour.
Evidence from several studies indicate that increases in violent actions against marginalized groups, which were held responsible for the Little Ice Age, overlap with the years of particularly cold, dry weather.
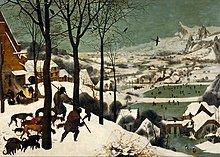
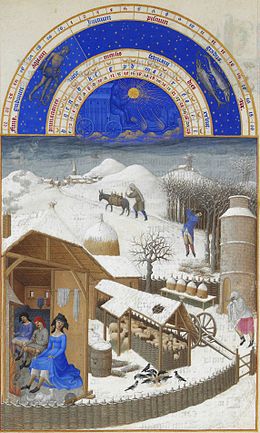
"[53] Wintry scenes, which entail technical difficulties in painting, have been regularly and well handled since at least the early 15th century by artists in illuminated manuscript cycles that show the Labours of the Months, typically placed on the calendar pages of books of hours.
[58] The General Crisis of the seventeenth century in Europe was a period of inclement weather, crop failure, economic hardship, extreme intergroup violence, and high mortality linked to the Little Ice Age.
[70] An analysis of several climate proxies undertaken in Mexico's Yucatán Peninsula, which was linked by its authors to Maya and Aztec chronicles relating periods of cold and drought, supports the existence of the Little Ice Age in the region.
[71] Another study conducted in several sites in Mesoamerica like Los Tuxtlas and Lake Pompal in Veracruz, Mexico show a decrease in human activity in the area during the Little Ice Age.
[75] Although the original designation of a Little Ice Age referred to the reduced temperature of Europe and North America, there is some evidence of extended periods of cooling outside those regions although it is not clear whether they are related or independent events.
In Southern Africa, sediment cores retrieved from Lake Malawi show colder conditions between 1570 and 1820, which "further support, and extend, the global expanse of the Little Ice Age".
[97] Pollen records derived from rock hyrax middens in the Cederberg Mountains of southwestern South Africa indicate an increase in humidity in the region at the start of the LIA.
[100] An ocean sediment core from the eastern Bransfield Basin in the Antarctic Peninsula shows centennial events, which the authors link to the Little Ice Age and to the Medieval Warm Period.
[103] Law Dome ice cores show lower levels of CO2 mixing ratios from 1550 to 1800, which Etheridge and Steele believe to be "probably as a result of colder global climate".
[107] As studied by Tibby et al. (2018), lake records from Victoria, New South Wales, and Queensland suggest that conditions in the east and the south-east of Australia were wet and unusually cool from the 16th to the early 19th centuries.
For example, North Stradbroke Island's Swallow Lagoon data reveals a period of persistent wetness from 1500 to 1850 CE (exceeding 300 mm above average), followed by a significant decrease in rainfall after 1891.
In the north, evidence suggests fairly dry conditions, but coral cores from the Great Barrier Reef show rainfall similar to today but with less variability.
A study that analyzed isotopes in Great Barrier Reef corals suggested that increased water vapor transport from the southern tropical oceans to the poles contributed to the Little Ice Age.
On the west coast of the Southern Alps of New Zealand, the Franz Josef Glacier advanced rapidly during the Little Ice Age and reached its maximum extent in the early 18th century.
[114] Based on dating of a yellow-green lichen of the Rhizocarpon subgenus, the Mueller Glacier, on the eastern flank of the Southern Alps within Aoraki / Mount Cook National Park, is considered to have been at its maximum extent between 1725 and 1730.
Such historical records indicate a general cooling in the area between 1675 and 1898: "The recognition of the LIA in northern Patagonia, through the use of documentary sources, provides important, independent evidence for the occurrence of this phenomenon in the region.
[128] It has been proposed that the Little Ice Age, locally lasting from the 17th to the 19th centuries, may have had a negative impact on the productivity of marine ecosystems and on the navigability of the Patagonian fjords and channels being thus detrimental to the sea-faring Kawésqar.
[138] Each ancient Middle Eastern empire had a significant supply of food: the Byzantines had Anatolia and Syria, the Abbasids had the lower Tigris-Euphrates region, as well as Khurasan and Bukhara, and the Ottomans had Egypt.
Other volcanoes that erupted during the era and may have contributed to the cooling include Billy Mitchell (c. 1580), Huaynaputina (1600), Mount Parker (1641), Long Island (Papua New Guinea) (ca.
[172][173][174] Some researchers have proposed that human influences on climate began earlier than is normally supposed (see Early anthropocene for more details) and that major population declines in Eurasia and the Americas reduced that impact and led to a cooling trend.
Changes in albedo were caused by widespread deforestation at high latitudes, which exposed more snow cover and thus increased reflectiveness of the Earth's surface, as land was cleared for agricultural use.