Statistical graphics
They can also provide insight into a data set to help with testing assumptions, model selection and regression model validation, estimator selection, relationship identification, factor effect determination, and outlier detection.
In addition, the choice of appropriate statistical graphics can provide a convincing means of communicating the underlying message that is present in the data to others.
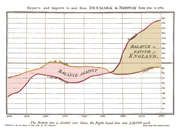
Statistical graphics have been central to the development of science and date to the earliest attempts to analyse data.
Many familiar forms, including bivariate plots, statistical maps, bar charts, and coordinate paper were used in the 18th century.
This article incorporates public domain material from the National Institute of Standards and Technology